Kidlington house prices
Homes in Kidlington sold for a median of £375,000, from 232 sales, Oct 2025 – Sept 2026.
The median is £33,000 above Cherwell. Sold prices from HM Land Registry, not valuations.
Kidlington house prices map
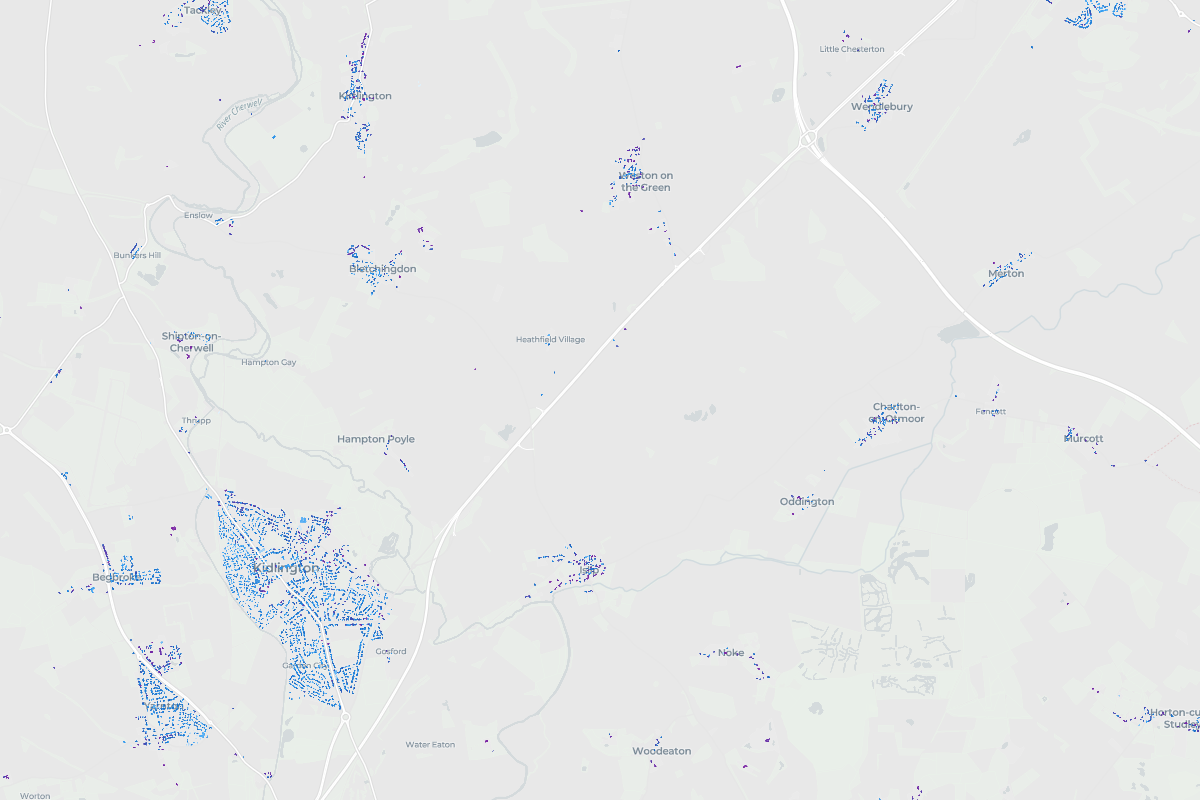
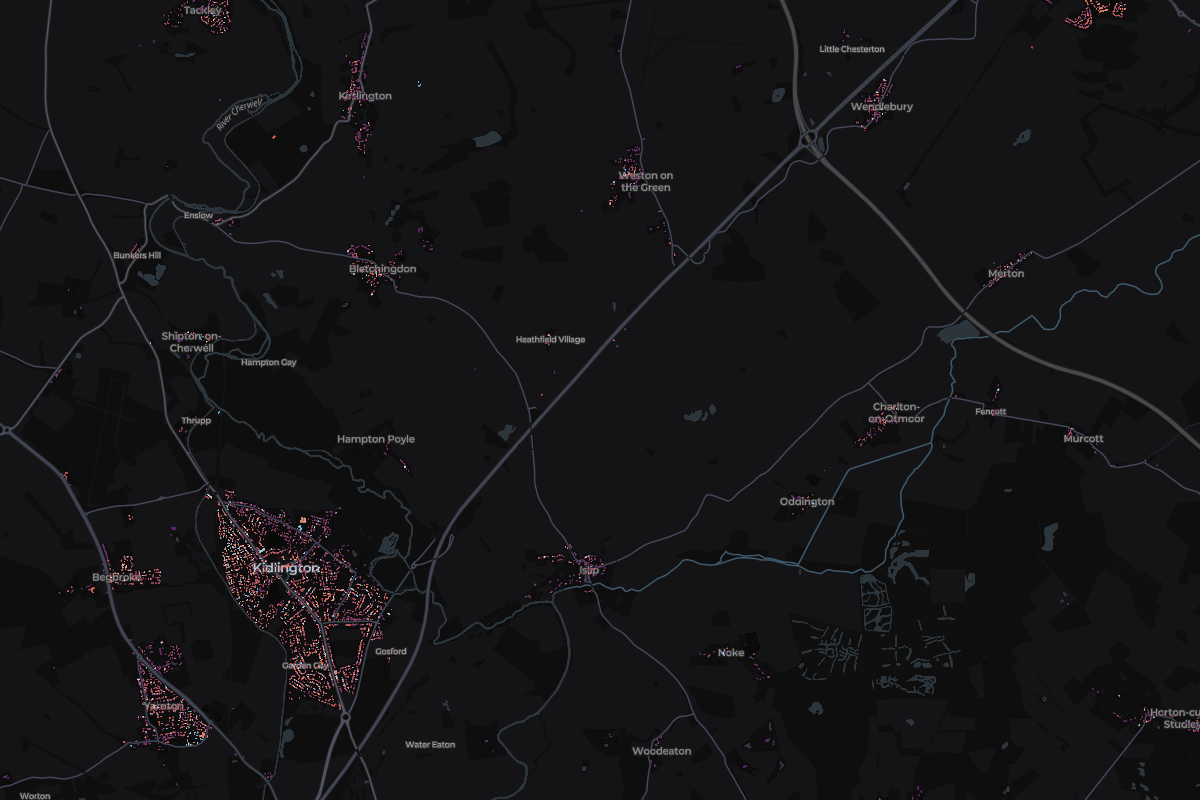
Tap any home in Kidlington to see what it sold for.
Most expensive homes in Kidlington
Sold Oct 2025 – Sept 2026. Tap a home to see it on the map.
Most expensive streets in Kidlington
Median sold price of streets with 3 or more home sales. Tap a street to see it on the map.
- England
£285,000
676,259 sales
- Oxfordshire
£395,000
8,277 sales
- Cherwell
£342,000
1,999 sales
Kidlington
£375,000
232 sales
- Change across the window
- +12.7%
- Sales
- 232
- Share of Cherwell
- 12%
1 of 3 places in Cherwell, by median
Median sold prices in Kidlington, compared with the wider area
- England
- Oxfordshire
- Cherwell
- Kidlington
Property type
Bar length is the share of sales. The price is the median.
- Detached£509,00054 sales
- Semi-detached£390,00089 sales
- Terraced£333,50060 sales
- Flat£216,50024 sales
- OtherNot enough sales5 sales
Price spread
Lower and upper quartile. The mark is the median.
£303,750£470,000
How the sales split
- Freehold88% 204 sales
- Leasehold12% 28 sales
- New build0% 0 sales
Places in Kidlington
From most to least expensive.
- Yarnton£422,50042 sales
- BegbrokeNot enough sales4 sales
- BletchingdonNot enough sales7 sales
- Charlton On OtmoorNot enough sales1 sale
- EnslowNot enough sales1 sale
- FencottNot enough sales2 sales
- GosfordNot enough sales1 sale
- IslipNot enough sales4 sales
- KirtlingtonNot enough sales3 sales
- MurcottNot enough sales3 sales