Cherwell house prices
Homes in Cherwell sold for a median of £342,000, from 1,999 sales, Oct 2025 – Sept 2026.
The median is £53,000 below Oxfordshire. Sold prices from HM Land Registry, not valuations.
Cherwell house prices map
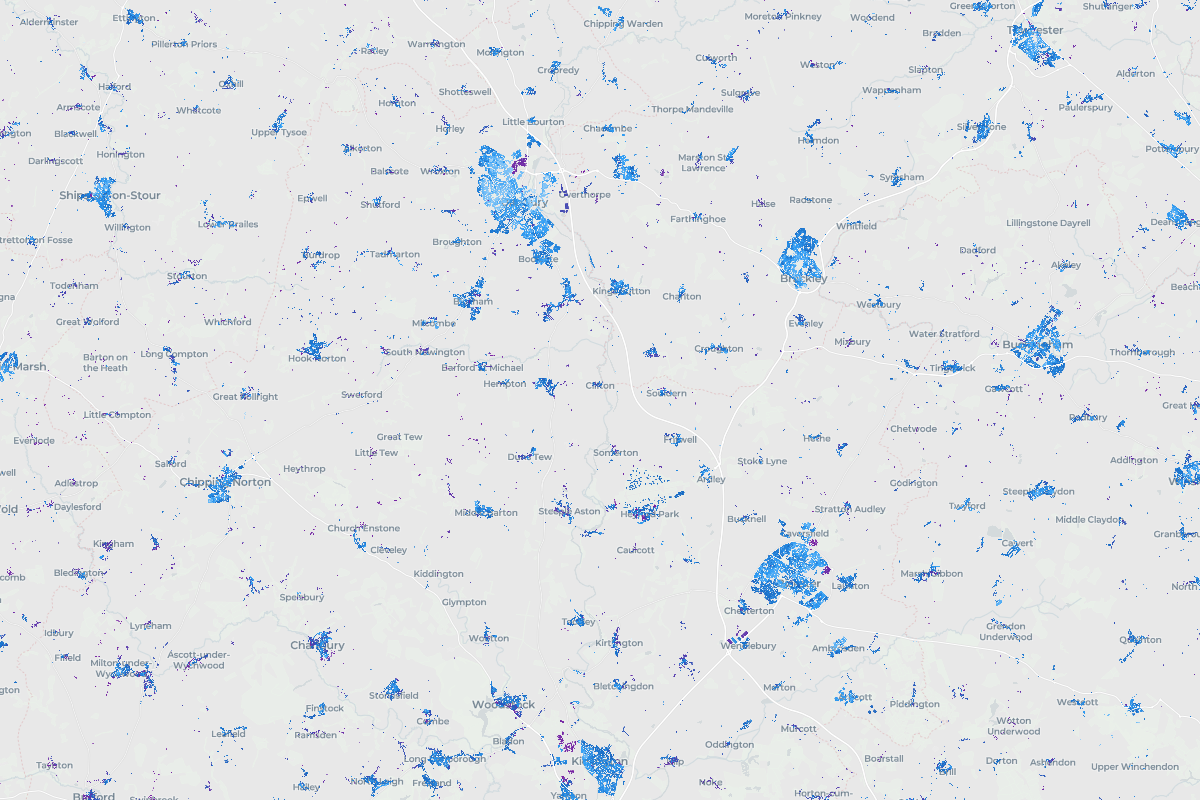
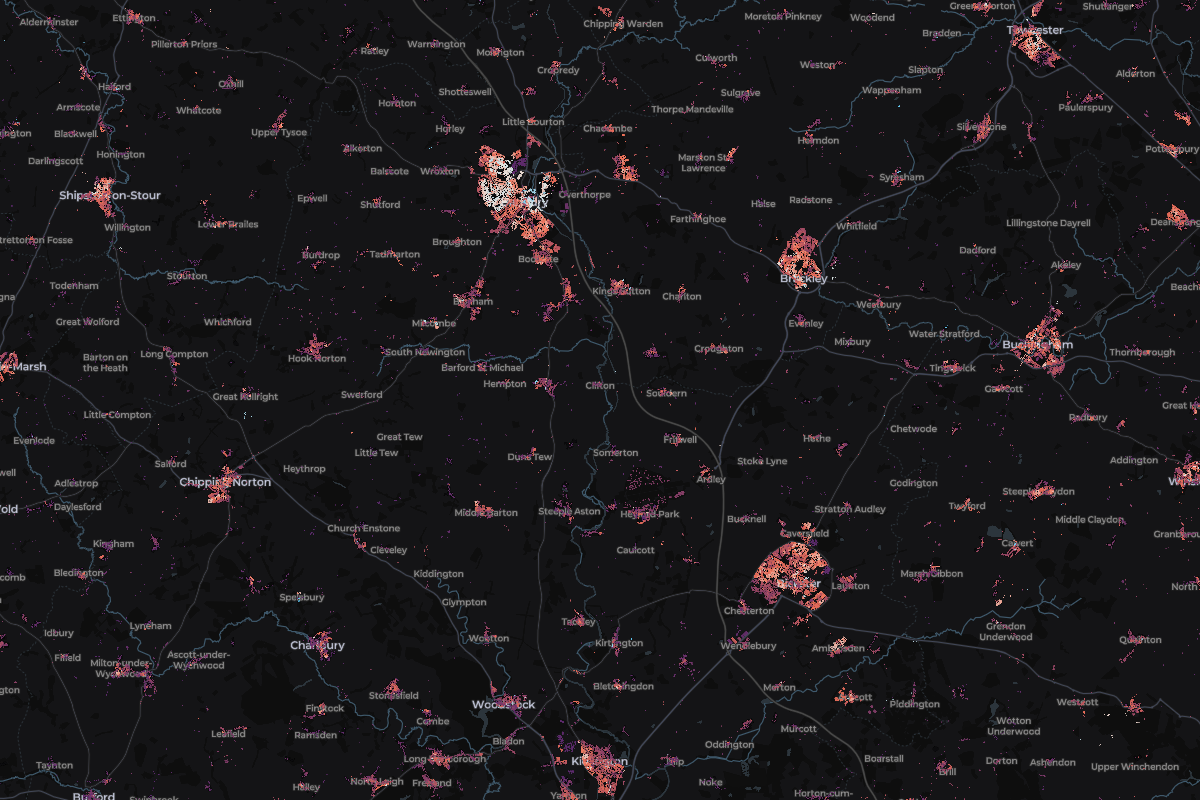
Tap any home in Cherwell to see what it sold for.
Most expensive homes in Cherwell
Sold Oct 2025 – Sept 2026. Tap a home to see it on the map.
- 1Old Rectory, Main StreetDetached · Mixbury · Oct 2025£4,100,000
- 2Park Farm House, Gullicote LaneDetached · Hanwell · Apr 2026£1,995,000
- 3Eden House, West End LaneDetached · Merton · Aug 2026£1,940,000
- 4Cherry Orchard, Green LaneDetached · South Newington · Aug 2026£1,900,000
- 5Sundown, Crowcastle LaneDetached · Kirtlington · Nov 2025£1,725,000
Show 5 moreShow the top 5 only
- 6Homewood, Middleton ParkDetached · Middleton Stoney · Jun 2026£1,650,000
- 7Cedar Lodge, Middleton ParkDetached · Middleton Stoney · Jun 2026£1,575,000
- 8Orchard View, Tithe LaneDetached · Clifton · May 2026£1,550,000
- 9Humber House, Humber StreetTerraced · Bloxham · Jan 2026£1,425,999
- 10Ivydene, East EndDetached · Hook Norton · Feb 2026£1,425,000
Most expensive streets in Cherwell
Median sold price of streets with 3 or more home sales. Tap a street to see it on the map.
- England
£285,000
676,259 sales
- Oxfordshire
£395,000
8,277 sales
Cherwell
£342,000
1,999 sales
- Change across the window
- +6%
- Sales
- 1,999
- Share of Oxfordshire
- 24%
5 of 5 places in Oxfordshire, by median
Median sold prices in Cherwell, compared with the wider area
- England
- Oxfordshire
- Cherwell
Property type
Bar length is the share of sales. The price is the median.
- Detached£475,975604 sales
- Semi-detached£335,000591 sales
- Terraced£290,000561 sales
- Flat£175,000174 sales
- Other£400,00069 sales
Price spread
Lower and upper quartile. The mark is the median.
£270,000£450,000
How the sales split
- Freehold89% 1,787 sales
- Leasehold11% 212 sales
- New build3% 56 sales
Places in Cherwell
From most to least expensive.