Bournemouth Christchurch And Poole house prices
Homes in Bournemouth Christchurch And Poole sold for a median of £329,475, from 5,404 sales, Oct 2025 – Sept 2026.
The median is £44,475 above England. Sold prices from HM Land Registry, not valuations.
Bournemouth Christchurch And Poole house prices map
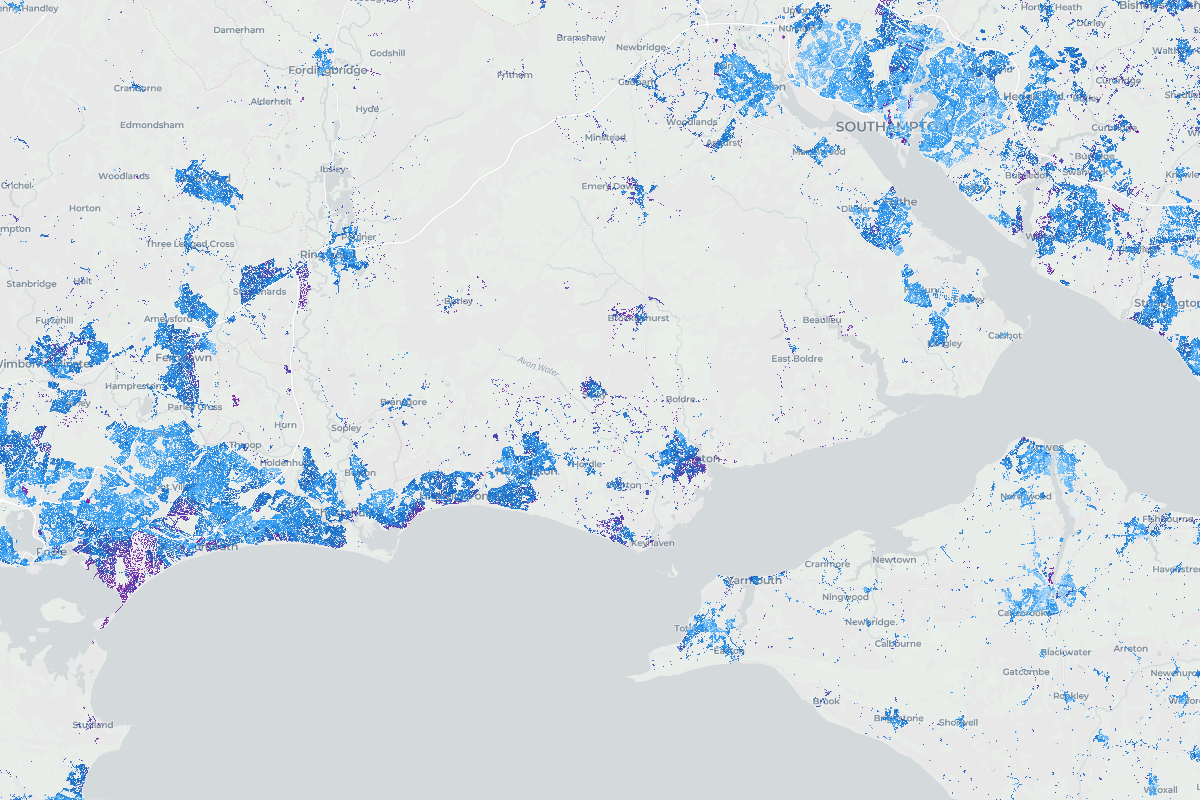
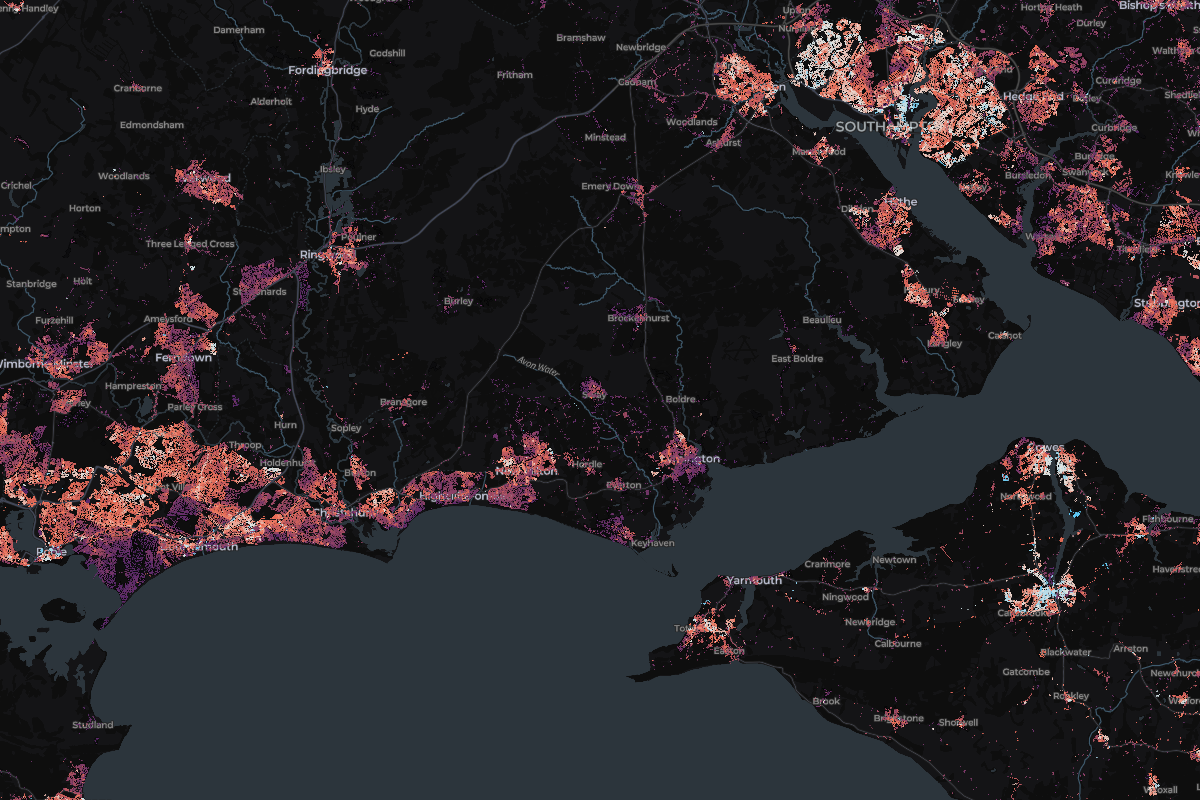
Tap any home in Bournemouth Christchurch And Poole to see what it sold for.
Most expensive homes in Bournemouth Christchurch And Poole
Sold Oct 2025 – Sept 2026. Tap a home to see it on the map.
- 1100 Panorama RoadDetached · Jul 2026£7,100,000
- 298 Panorama RoadDetached · Mar 2026£5,750,000
- 31 Firs LaneDetached · Dec 2025£5,030,000
- 4Parkwood, 26 Western AvenueDetached · Branksome Park · Mar 2026£4,500,000
- 56 Mornish RoadDetached · Nov 2025£3,811,500
Show 5 moreShow the top 5 only
- 6Harbour Side, 1 Brudenell AvenueDetached · Canford Cliffs · Jul 2026£3,600,000
- 72 The HorseshoeDetached · Aug 2026£3,400,000
- 819 Wilderton RoadDetached · Feb 2026£3,150,000
- 926 Bingham AvenueDetached · Oct 2025£2,975,000
- 102 Dalkeith RoadDetached · Nov 2025£2,550,000
Most expensive streets in Bournemouth Christchurch And Poole
Median sold price of streets with 3 or more home sales. Tap a street to see it on the map.
- 1Panorama RoadBournemouth Christchurch And Poole£3,462,5004 sales
- 2Wilderton RoadBournemouth Christchurch And Poole£2,200,0003 sales
- 3Orchard AvenueBournemouth Christchurch And Poole£1,200,0003 sales
- 4Martello ParkBournemouth Christchurch And Poole£1,191,2504 sales
- 5Compton AvenueBournemouth Christchurch And Poole£1,150,0003 sales
- England
£285,000
676,259 sales
Bournemouth Christchurch And Poole
£329,475
5,404 sales
- Change across the window
- +6.1%
- Sales
- 5,404
- Share of England
- 0.80%
29 of 88 places in England, by median
Median sold prices in Bournemouth Christchurch And Poole, compared with the wider area
- England
- Bournemouth Christchurch And Poole
Property type
Bar length is the share of sales. The price is the median.
- Detached£460,0001,957 sales
- Semi-detached£340,000848 sales
- Terraced£297,500682 sales
- Flat£210,0001,741 sales
- Other£340,000176 sales
Price spread
Lower and upper quartile. The mark is the median.
£238,000£450,000
How the sales split
- Freehold67% 3,606 sales
- Leasehold33% 1,798 sales
- New build0% 22 sales
Places in Bournemouth Christchurch And Poole
From most to least expensive.
- Talbot Woods£850,00019 sales
- Canford Cliffs£588,00018 sales
- Broadstone£480,000159 sales
- Wimborne£470,00069 sales
- Walkford£442,50042 sales
- Oakdale£425,00033 sales
- Moordown£403,50062 sales
- Highcliffe£400,000164 sales
- Southbourne£398,500112 sales
- Northbourne£395,00013 sales
Show the other 50 placesShow the top 10 only
- Burton£360,00044 sales
- Parkstone£335,000107 sales
- Branksome Park£332,50072 sales
- Ensbury Park£329,00038 sales
- Bear Cross£325,00013 sales
- Upton£320,0009 sales
- Pokesdown£317,50025 sales
- Winton£314,00053 sales
- Kinson£312,25012 sales
- Bearwood£310,00052 sales
- Wallisdown£310,00011 sales
- Canford Heath£305,00093 sales
- Creekmoor£303,75040 sales
- Throop£292,50010 sales
- Springbourne£288,00010 sales
- Hamworthy£286,50049 sales
- Muscliff£285,00019 sales
- Queens Park£261,0008 sales
- Westbourne£250,00057 sales
- Branksome£243,50020 sales
- Boscombe£203,00096 sales
- Meyrick Park£179,25016 sales
- AlderneyNot enough sales4 sales
- Alum ChineNot enough sales7 sales
- Boscombe EastNot enough sales6 sales
- BridgemaryNot enough sales1 sale
- CharminsterNot enough sales4 sales
- East CliffNot enough sales4 sales
- East HoweNot enough sales1 sale
- Friars CliffNot enough sales7 sales
- HurnNot enough sales1 sale
- LilliputNot enough sales6 sales
- LittledownNot enough sales1 sale
- LongfleetNot enough sales1 sale
- Lower ParkstoneNot enough sales3 sales
- MudefordNot enough sales5 sales
- MuscliffeNot enough sales4 sales
- Nuffield Industrial EstateNot enough sales3 sales
- PurewellNot enough sales7 sales
- RedhillNot enough sales3 sales
- SandbanksNot enough sales7 sales
- SomerfordNot enough sales3 sales
- St Catherines HillNot enough sales4 sales
- Stanley GreenNot enough sales3 sales
- StanpitNot enough sales2 sales
- StroudenNot enough sales3 sales
- Talbot VillageNot enough sales2 sales
- TucktonNot enough sales5 sales
- WickNot enough sales2 sales
- WinktonNot enough sales4 sales