Walkford house prices
Homes in Walkford sold for a median of £442,500, from 42 sales, Oct 2025 – Sept 2026.
The median is £113,025 above Bournemouth Christchurch And Poole. Sold prices from HM Land Registry, not valuations.
Walkford house prices map
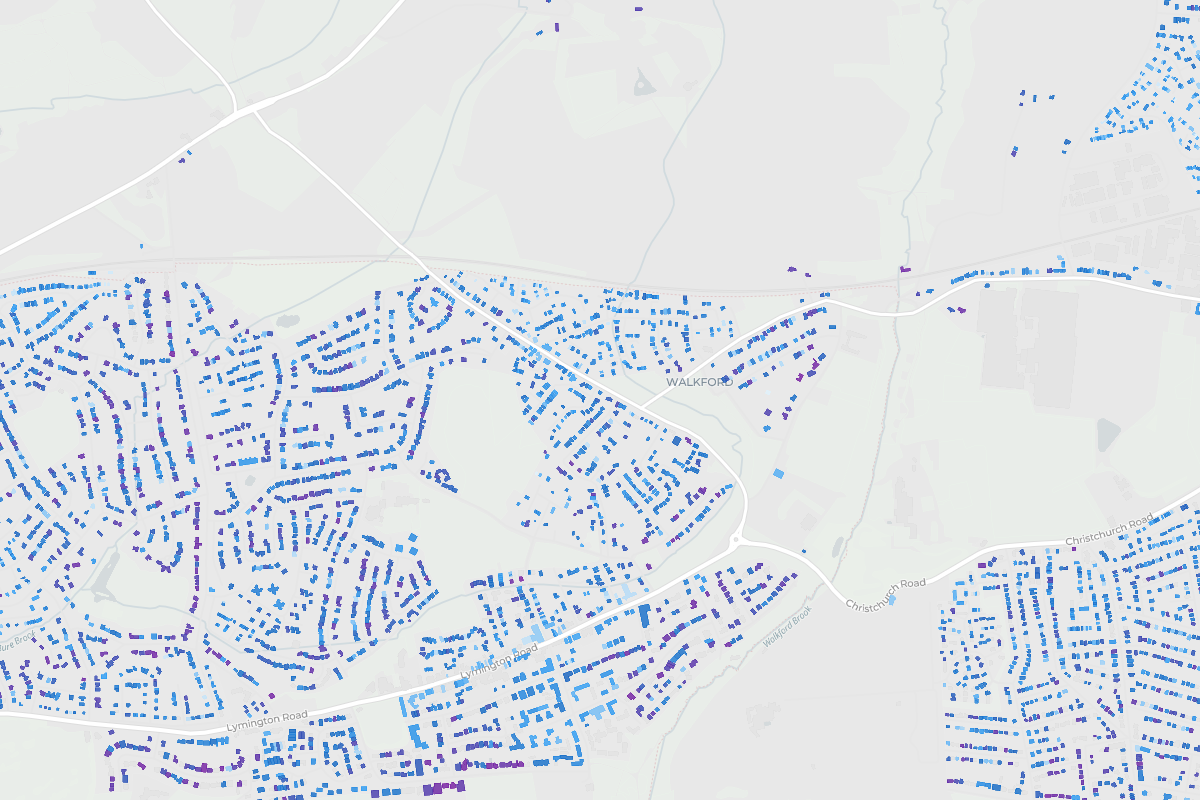
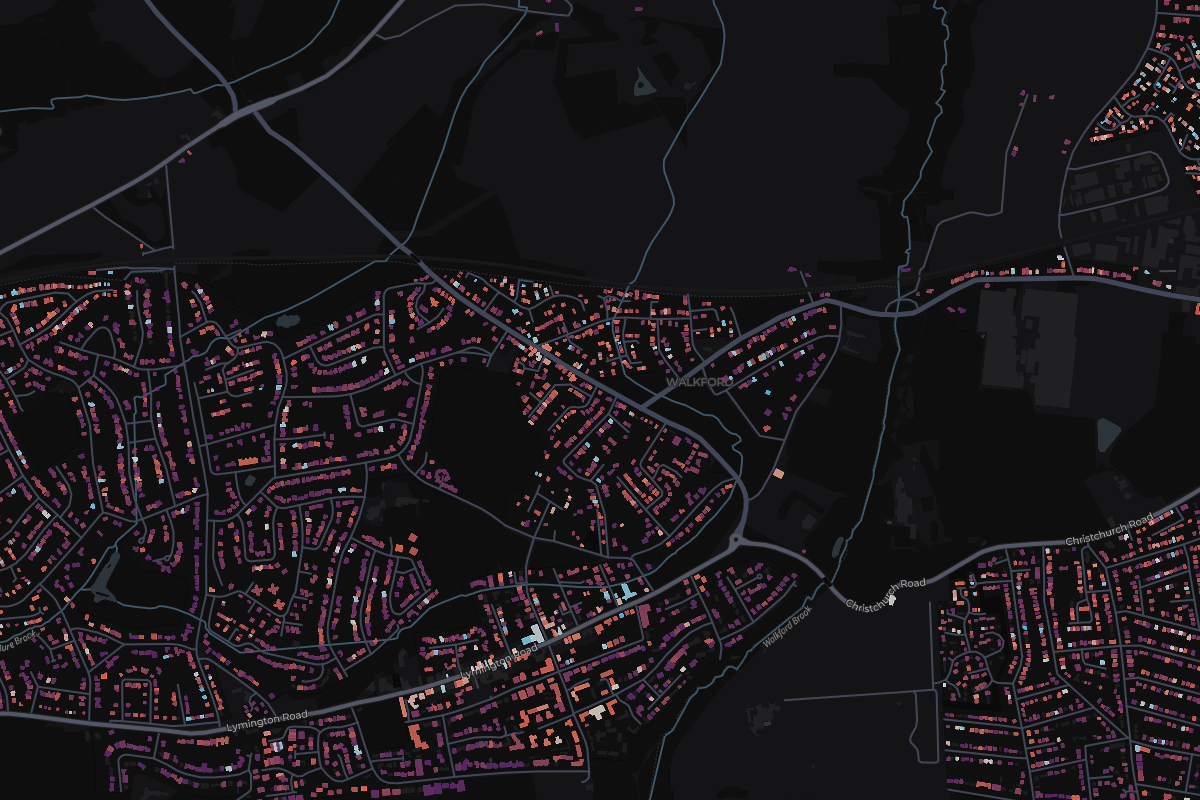
Tap any home in Walkford to see what it sold for.
Most expensive homes in Walkford
Sold Oct 2025 – Sept 2026. Tap a home to see it on the map.
Most expensive streets in Walkford
From most to least expensive. Tap a street to see it on the map.
- Walkford Road£673,7502 sales
- Pinewood Close£625,0002 sales
- Jacobean Close£567,0742 sales
- Bracken Way£515,0002 sales
- Ringwood Road£500,0009 sales
- Glenville Road£442,5004 sales
- Arran Way£429,9752 sales
- The Glen£423,5002 sales
- Forest View£320,0004 sales
- Southwood Avenue£313,0002 sales
Show the other 1 streetShow the top 10 only
- England
£285,000
676,259 sales
- Bournemouth Christchurch And Poole
£329,475
5,404 sales
Walkford
£442,500
42 sales
- Price per square metre
- £3,846
- Sales
- 42
- Share of Bournemouth Christchurch And Poole
- 0.78%
Median of recent sales divided by the energy certificate floor area.
5 of 32 places in Bournemouth Christchurch And Poole, by median
Median sold prices in Walkford, compared with the wider area
- England
- Bournemouth Christchurch And Poole
- Walkford
Property type
Bar length is the share of sales. The price is the median.
- Detached£515,00021 sales
- Semi-detached£435,0009 sales
- Terraced£319,9758 sales
- FlatNot enough sales3 sales
- OtherNot enough sales1 sales
Price spread
Lower and upper quartile. The mark is the median.
£336,500£541,250
How the sales split
- Freehold93% 39 sales
- Leasehold7% 3 sales
- New build0% 0 sales