Runnymede house prices
Homes in Runnymede sold for a median of £450,000, from 1,054 sales, Oct 2025 – Sept 2026.
The median is £40,000 below Surrey. Sold prices from HM Land Registry, not valuations.
Runnymede house prices map
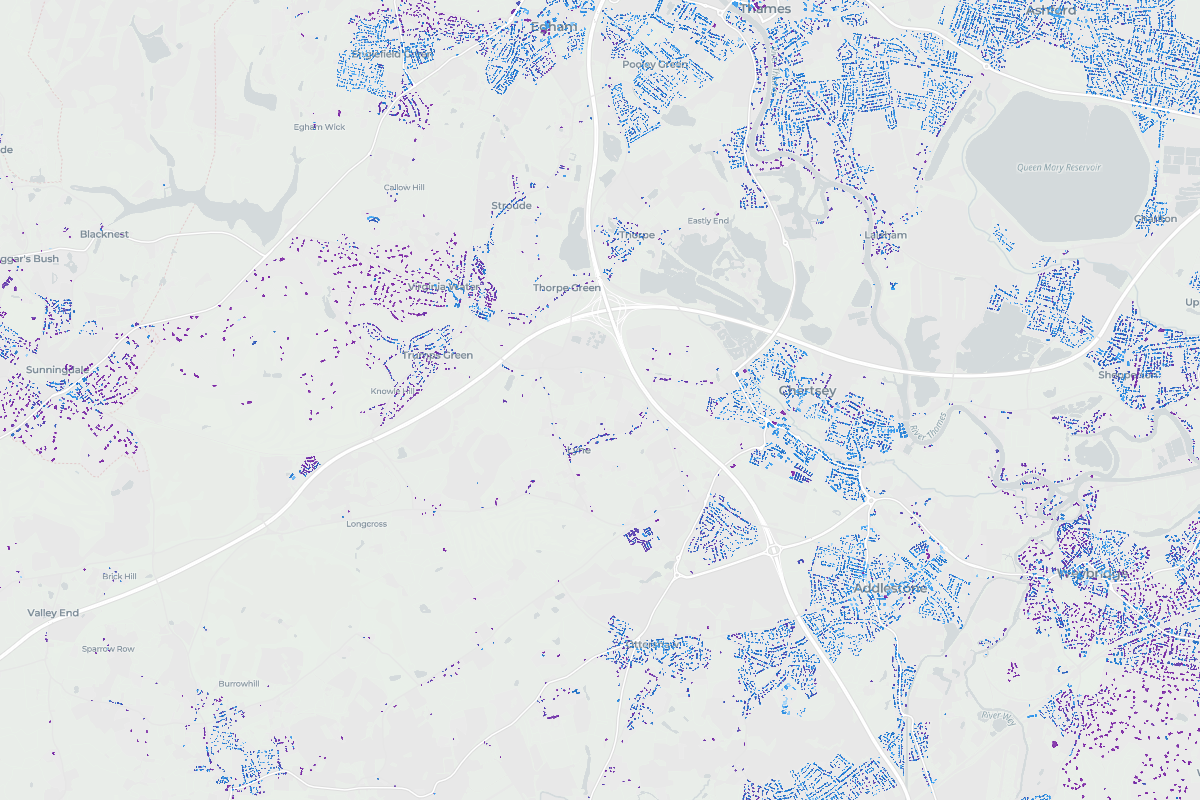
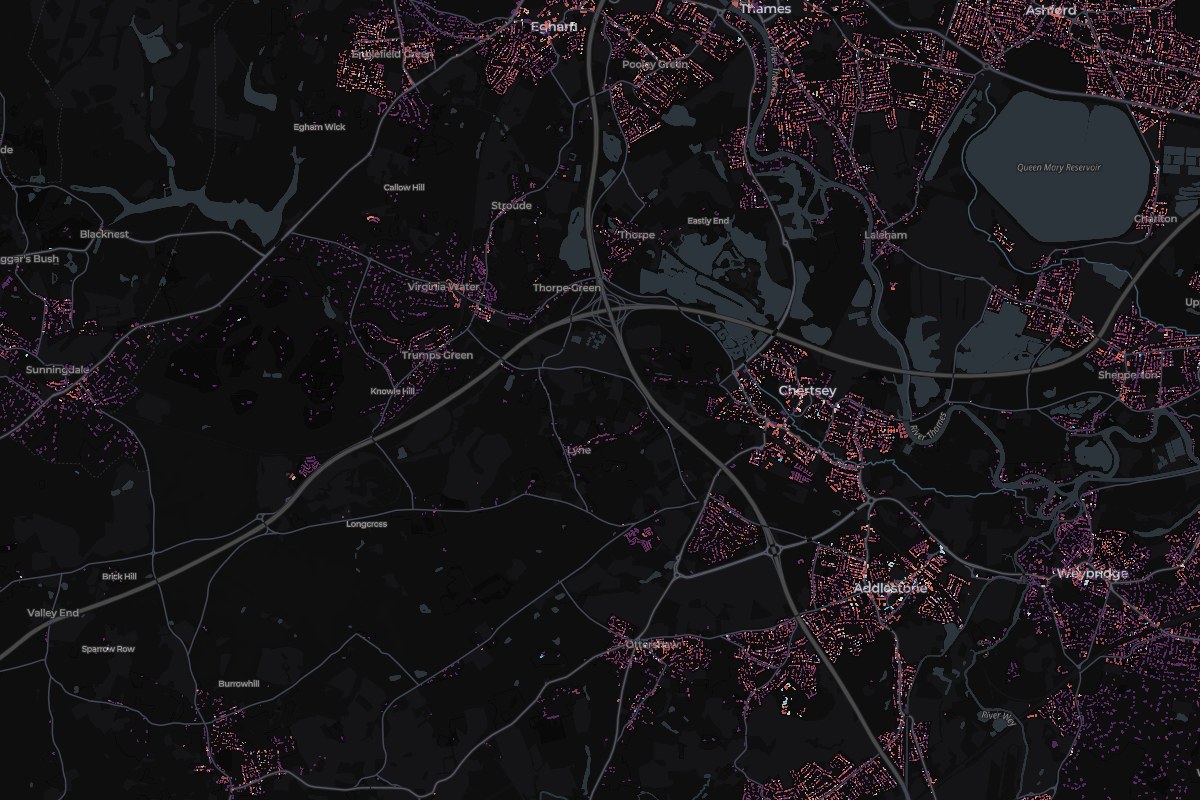
Tap any home in Runnymede to see what it sold for.
Most expensive homes in Runnymede
Sold Oct 2025 – Sept 2026. Tap a home to see it on the map.
- 1Springacres, Spring WoodsDetached · Virginia Water · Jun 2026£7,000,000
- 211 Oakwood RoadDetached · Virginia Water · Mar 2026£3,800,000
- 37 Abbey RoadDetached · Virginia Water · Apr 2026£3,370,000
- 4Shamwari, Gorse Hill RoadDetached · Virginia Water · Dec 2025£3,200,000
- 5High Acre, Portnall DriveDetached · Virginia Water · Dec 2025£3,000,000
Show 5 moreShow the top 5 only
- 6Camelot, BournesideDetached · Virginia Water · Oct 2025£2,900,000
- 7Oakmont, Longcross RoadDetached · Longcross · Dec 2025£2,800,000
- 8Accra, Temple GardensDetached · Staines Upon Thames · Apr 2026£2,250,000
- 917 Clarence DriveDetached · Englefield Green · Jun 2026£1,999,999
- 10High Beeches, Pipers EndDetached · Virginia Water · Mar 2026£1,950,000
Most expensive streets in Runnymede
Median sold price of streets with 3 or more home sales. Tap a street to see it on the map.
- Change across the window
- -1.6%
- Sales
- 1,054
- Share of Surrey
- 7%
10 of 11 places in Surrey, by median
Median sold prices in Runnymede, compared with the wider area
- England
- Surrey
- Runnymede
Property type
Bar length is the share of sales. The price is the median.
- Detached£700,000223 sales
- Semi-detached£500,000335 sales
- Terraced£420,000202 sales
- Flat£256,000249 sales
- Other£360,00045 sales
Price spread
Lower and upper quartile. The mark is the median.
£317,500£587,396
How the sales split
- Freehold75% 790 sales
- Leasehold25% 264 sales
- New build1% 9 sales
Places in Runnymede
From most to least expensive.