Bury St Edmunds house prices
Homes in Bury St Edmunds sold for a median of £416,000, from 44 sales, Oct 2025 – Sept 2026.
The median is £96,000 above Babergh. Sold prices from HM Land Registry, not valuations.
Bury St Edmunds house prices map
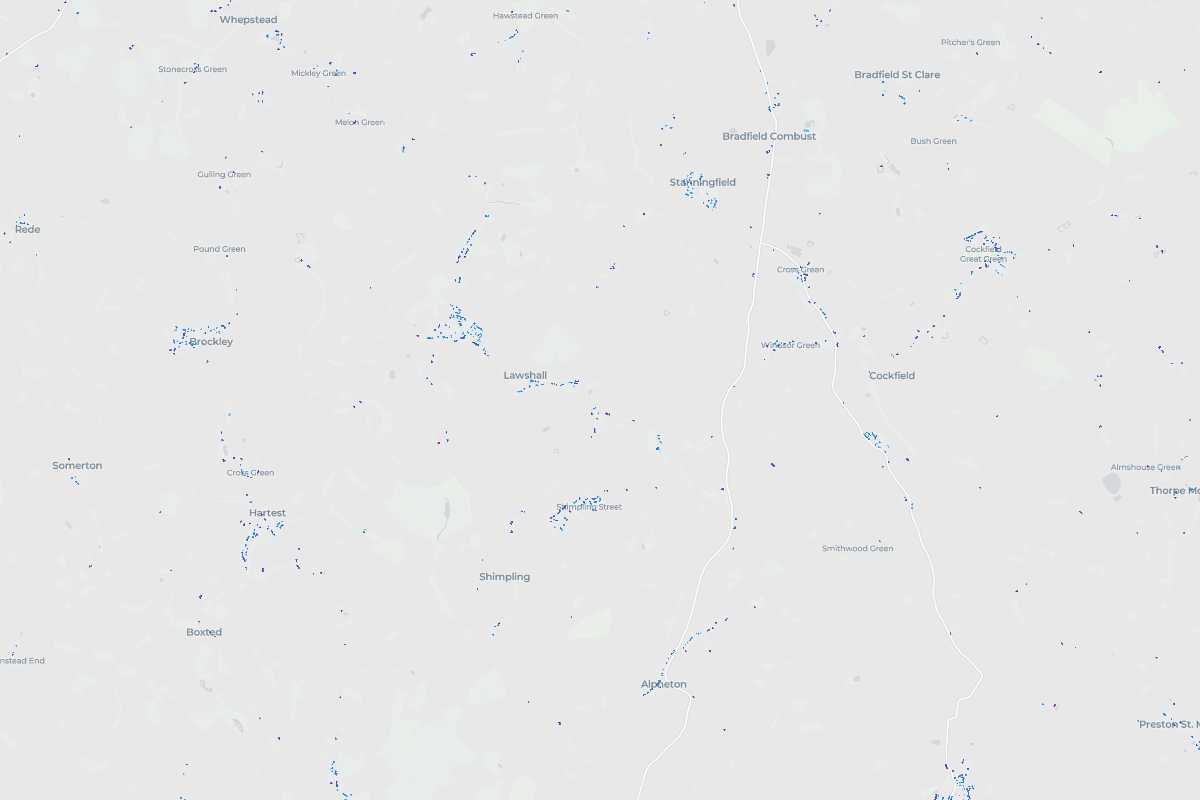
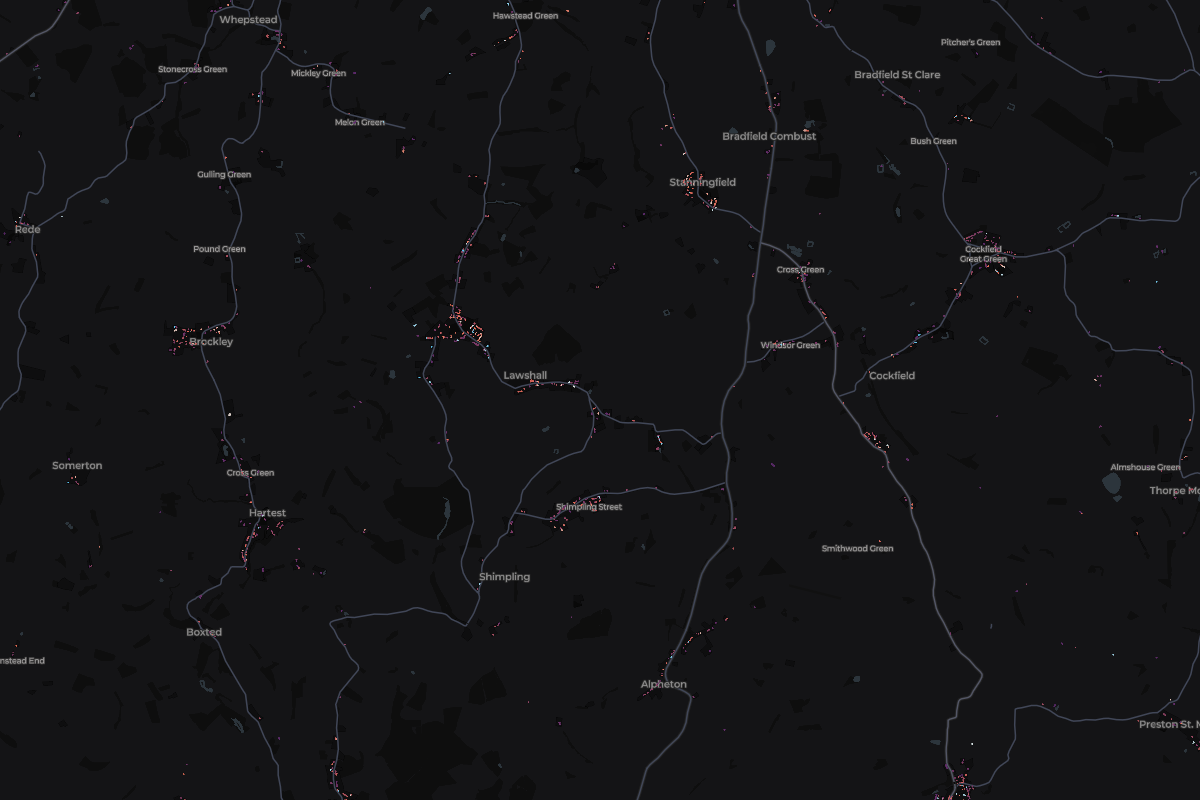
Tap any home in Bury St Edmunds to see what it sold for.
Most expensive homes in Bury St Edmunds
Sold Oct 2025 – Sept 2026. Tap a home to see it on the map.
- 1Old Hall Barn, Old Hall LaneDetached · Cockfield · Oct 2025£1,478,543
- 2The Hamptons, Little ChadacreDetached · Shimpling · Oct 2025£835,000
- 3Peartrees, Great GreenDetached · Cockfield · Nov 2025£700,000
- 4Ruffles, The StreetDetached · Shimpling · Oct 2025£645,000
- 5Home Farm House, Bury RoadSemi-detached · Thorpe Morieux · Nov 2025£640,000
Show 5 moreShow the top 5 only
- 6Marchwood House, The StreetSemi-detached · Shimpling · Nov 2025£610,000
- 7Quince Lodge, Great GreenSemi-detached · Cockfield · Aug 2026£580,000
- 8Roundwood House, Windsor GreenDetached · Cockfield · Jul 2026£550,000
- 9The Old Quail Coop, Folly LaneSemi-detached · Lawshall · Oct 2025£535,000
- 10Mayland, The StreetDetached · Shimpling · Apr 2026£525,000
Most expensive streets in Bury St Edmunds
Median sold price of streets with 3 or more home sales. Tap a street to see it on the map.
- Change across the window
- +7.3%
- Sales
- 44
- Share of Babergh
- 3%
9 of 26 places in Babergh, by median
Median sold prices in Bury St Edmunds, compared with the wider area
- England
- Suffolk
- Babergh
- Bury St Edmunds
Property type
Bar length is the share of sales. The price is the median.
- Detached£445,00021 sales
- Semi-detached£380,00014 sales
- TerracedNot enough sales3 sales
- FlatNot enough sales1 sales
- OtherNot enough sales5 sales
Price spread
Lower and upper quartile. The mark is the median.
£349,375£527,500
How the sales split
- Freehold98% 43 sales
- Leasehold2% 1 sales
- New build0% 0 sales
Places in Bury St Edmunds
From most to least expensive.