Carterton house prices
Homes in Carterton sold for a median of £345,000, from 217 sales, Oct 2025 – Sept 2026.
The median is £40,000 below West Oxfordshire. Sold prices from HM Land Registry, not valuations.
Carterton house prices map
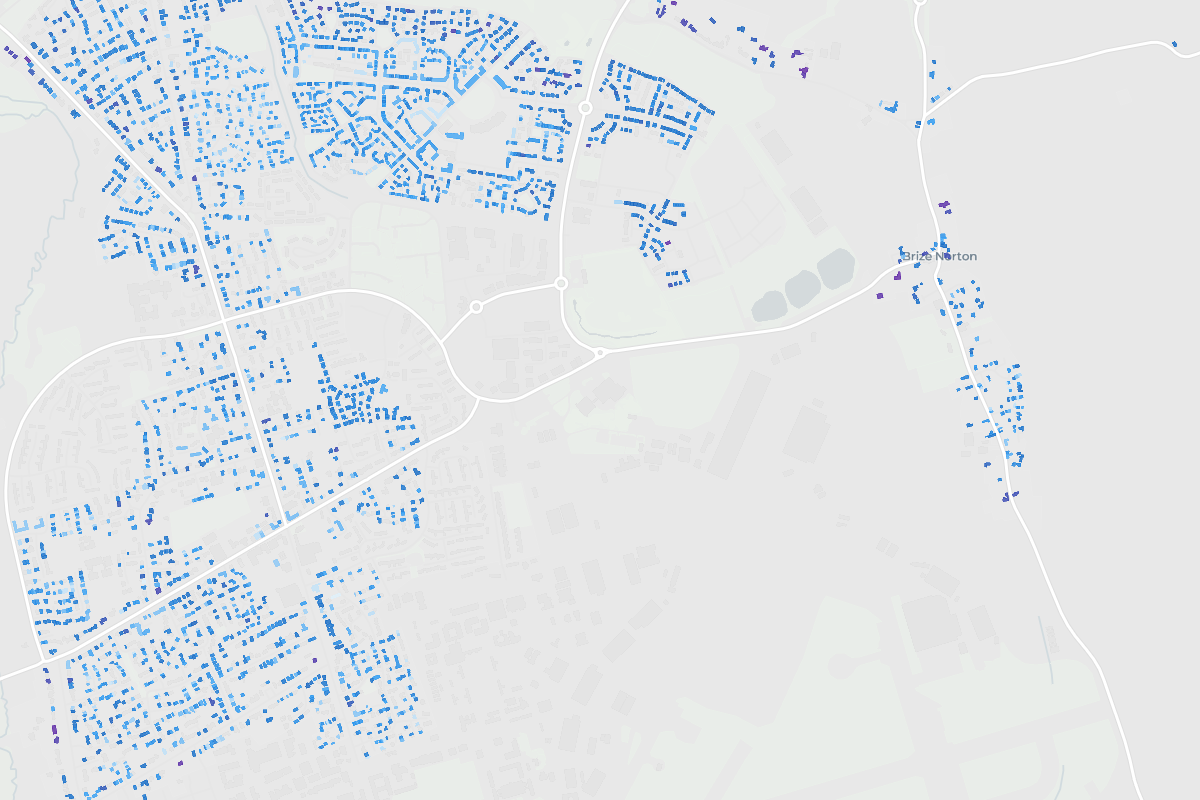
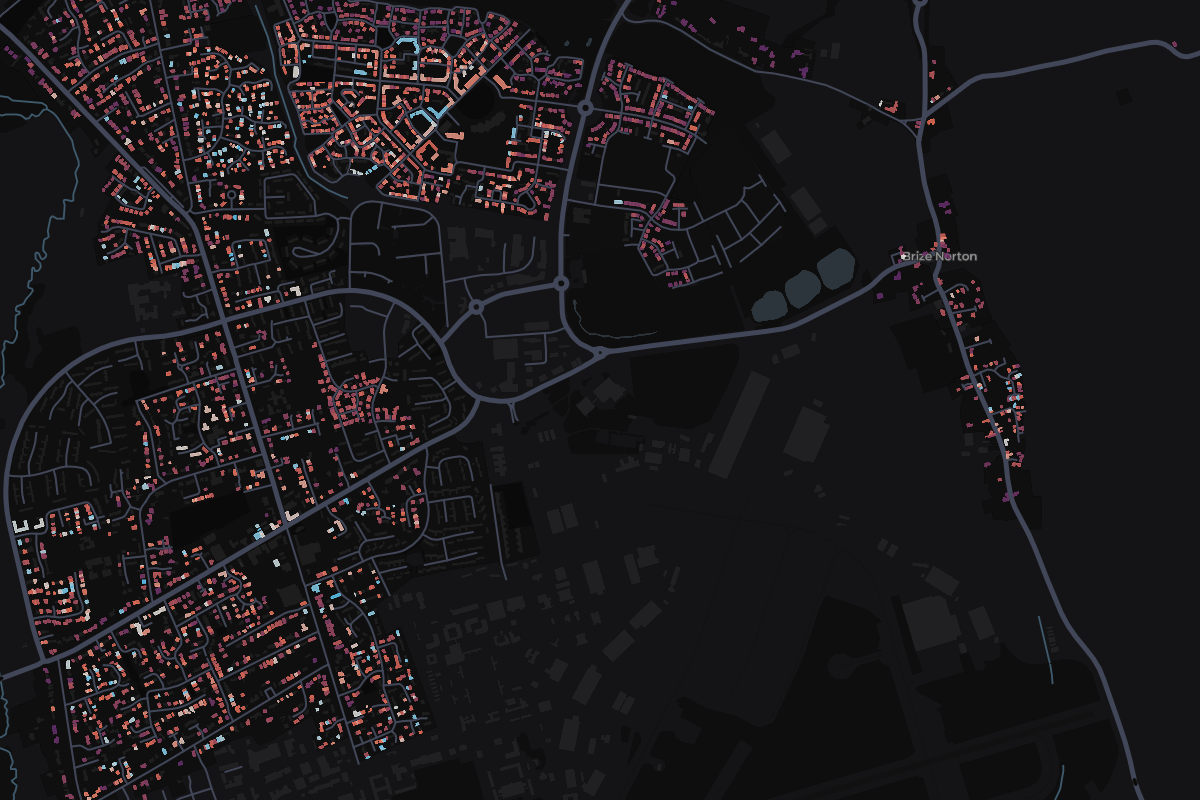
Tap any home in Carterton to see what it sold for.
Most expensive homes in Carterton
Sold Oct 2025 – Sept 2026. Tap a home to see it on the map.
- 1Rosedale, Burford RoadDetached · Brize Norton · May 2026£810,000
- 23 Tansy WayDetached · Jan 2026£710,000
- 3Midfield, 37 Swinbrook RoadDetached · Dec 2025£650,000
- 42 Bryony GardensDetached · May 2026£650,000
- 52 Lawton AvenueDetached · Mar 2026£636,000
Most expensive streets in Carterton
Median sold price of streets with 3 or more home sales. Tap a street to see it on the map.
- 1Shilton RoadCarterton£532,5004 sales
- 2Swinbrook RoadCarterton£495,0006 sales
- 3Miles DriveBrize Norton£485,0003 sales
- 4Black Bourton RoadCarterton£410,0003 sales
- 5Brome WayCarterton£408,7504 sales
Show 5 moreShow the top 5 only
- 6Oakfield RoadCarterton£399,2504 sales
- 7Butlers DriveCarterton£390,0003 sales
- 8Ash AvenueCarterton£375,0003 sales
- 9Wilkins CloseBrize Norton£375,0003 sales
- 10Wright PlaceBrize Norton£367,0003 sales
- England
£285,000
676,259 sales
- Oxfordshire
£395,000
8,277 sales
- West Oxfordshire
£385,000
1,436 sales
Carterton
£345,000
217 sales
- Change across the window
- -19.7%
- Sales
- 217
- Share of West Oxfordshire
- 15%
7 of 7 places in West Oxfordshire, by median
Median sold prices in Carterton, compared with the wider area
- England
- Oxfordshire
- West Oxfordshire
- Carterton
Property type
Bar length is the share of sales. The price is the median.
- Detached£452,50074 sales
- Semi-detached£346,13864 sales
- Terraced£310,00044 sales
- Flat£180,00030 sales
- OtherNot enough sales5 sales
Price spread
Lower and upper quartile. The mark is the median.
£280,000£402,878
How the sales split
- Freehold85% 185 sales
- Leasehold15% 32 sales
- New build2% 5 sales
Places in Carterton
From most to least expensive.