Henley On Thames house prices
Homes in Henley On Thames sold for a median of £750,000, from 265 sales, Oct 2025 – Sept 2026.
The median is £305,000 above South Oxfordshire. Sold prices from HM Land Registry, not valuations.
Henley On Thames house prices map
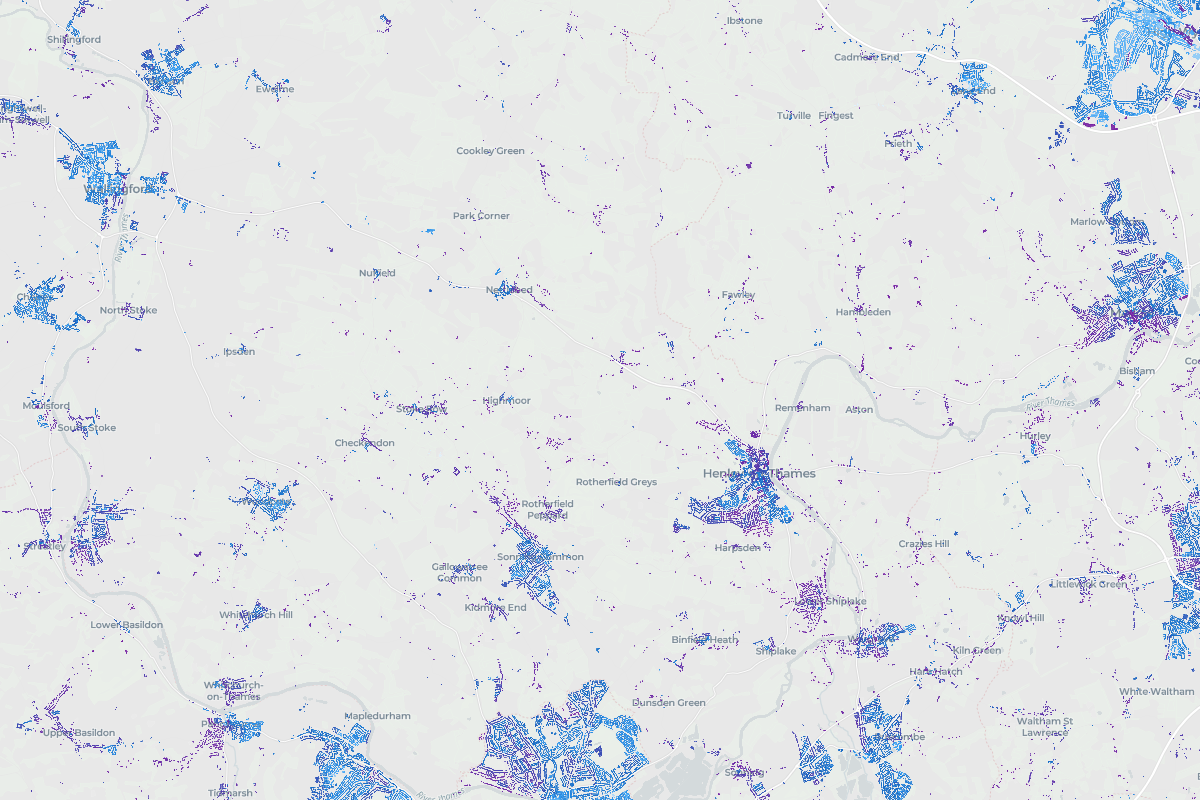
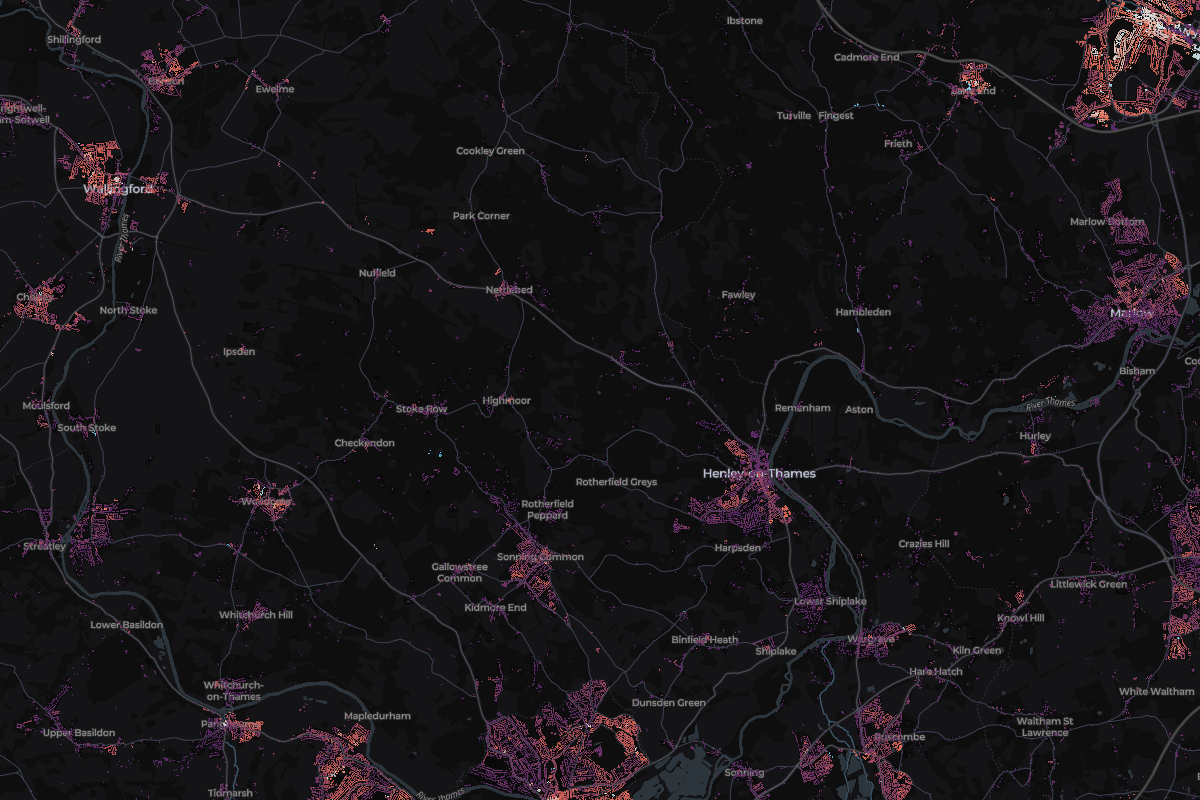
Tap any home in Henley On Thames to see what it sold for.
Most expensive homes in Henley On Thames
Sold Oct 2025 – Sept 2026. Tap a home to see it on the map.
- 1Magnolia Wharf, Basmore LaneDetached · Shiplake · Oct 2025£3,800,000
- 2Springfield House, Shepherds GreenDetached · Rotherfield Greys · Apr 2026£2,940,000
- 310 St Andrews RoadDetached · Aug 2026£2,691,900
- 431 New StreetTerraced · May 2026£2,250,000
- 5Deerswood, White LaneDetached · Bix · Jun 2026£2,200,000
Show 5 moreShow the top 5 only
- 6Field House, 43 Deanfield AvenueDetached · Jan 2026£2,100,000
- 726c Rotherfield RoadDetached · Jan 2026£1,925,000
- 86 Marlow RoadSemi-detached · Nov 2025£1,925,000
- 9Goodwood, Reading RoadDetached · Shiplake · Oct 2025£1,910,000
- 10Hillside House, Baskerville LaneDetached · Shiplake · Mar 2026£1,860,000
Most expensive streets in Henley On Thames
Median sold price of streets with 3 or more home sales. Tap a street to see it on the map.
- England
£285,000
676,259 sales
- Oxfordshire
£395,000
8,277 sales
- South Oxfordshire
£445,000
1,800 sales
Henley On Thames
£750,000
265 sales
- Change across the window
- -17.6%
- Sales
- 265
- Share of South Oxfordshire
- 15%
1 of 17 places in South Oxfordshire, by median
Median sold prices in Henley On Thames, compared with the wider area
- England
- Oxfordshire
- South Oxfordshire
- Henley On Thames
Property type
Bar length is the share of sales. The price is the median.
- Detached£1,200,00087 sales
- Semi-detached£645,00054 sales
- Terraced£570,00068 sales
- Flat£374,99740 sales
- Other£1,250,00016 sales
Price spread
Lower and upper quartile. The mark is the median.
£470,000£1,175,000
How the sales split
- Freehold83% 221 sales
- Leasehold17% 44 sales
- New build2% 4 sales
Places in Henley On Thames
From most to least expensive.
- Shiplake£1,680,0009 sales
- Peppard Common£900,00010 sales
- Rotherfield Greys£889,5758 sales
- Nettlebed£765,00013 sales
- BadgemoreNot enough sales2 sales
- Binfield HeathNot enough sales6 sales
- BixNot enough sales3 sales
- CrowsleyNot enough sales1 sale
- HarpsdenNot enough sales3 sales
- HighmoorNot enough sales3 sales
Show the other 9 placesShow the top 10 only
- Highmoor CrossNot enough sales2 sales
- KingwoodNot enough sales4 sales
- Middle AssendonNot enough sales2 sales
- PishillNot enough sales3 sales
- Rotherfield PeppardNot enough sales4 sales
- Shiplake CrossNot enough sales2 sales
- Stoke RowNot enough sales7 sales
- SwyncombeNot enough sales1 sale
- Witheridge HillNot enough sales1 sale