Mansfield house prices
Homes in Mansfield sold for a median of £180,000, from 1,422 sales, Oct 2025 – Sept 2026.
The median is £40,000 below Nottinghamshire. Sold prices from HM Land Registry, not valuations.
Mansfield house prices map
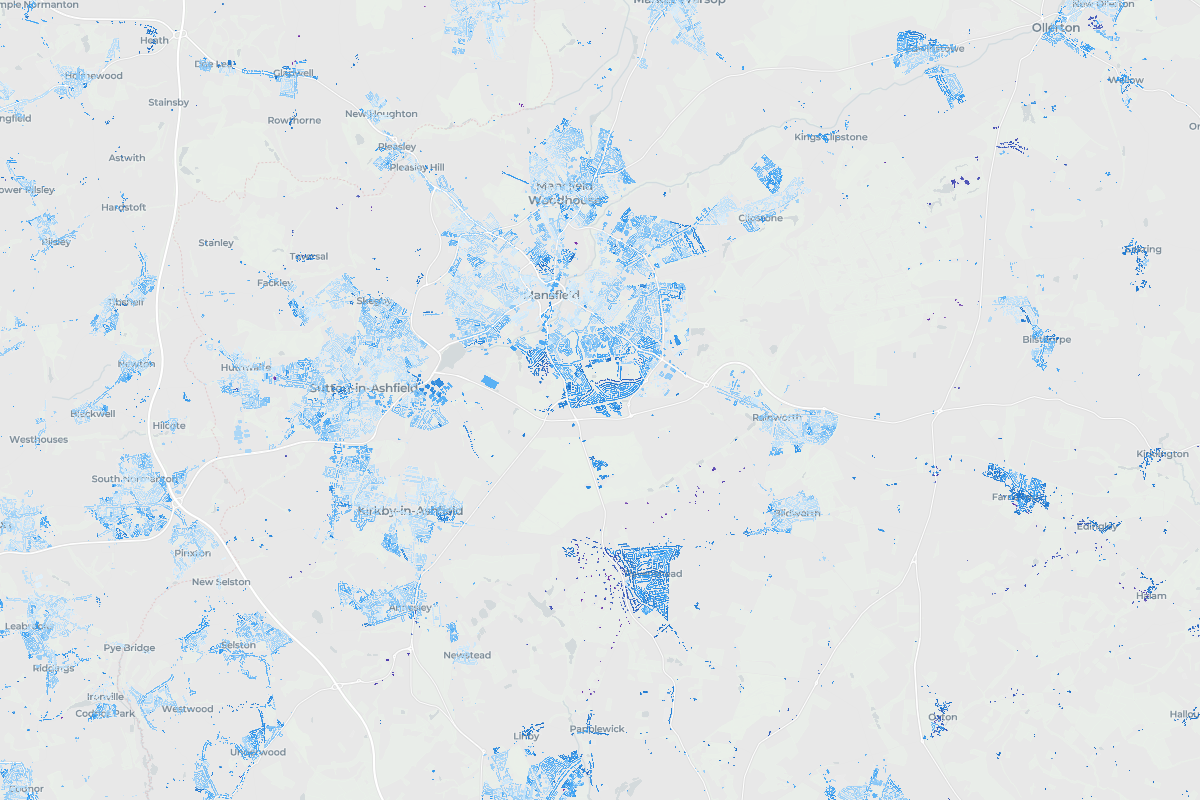
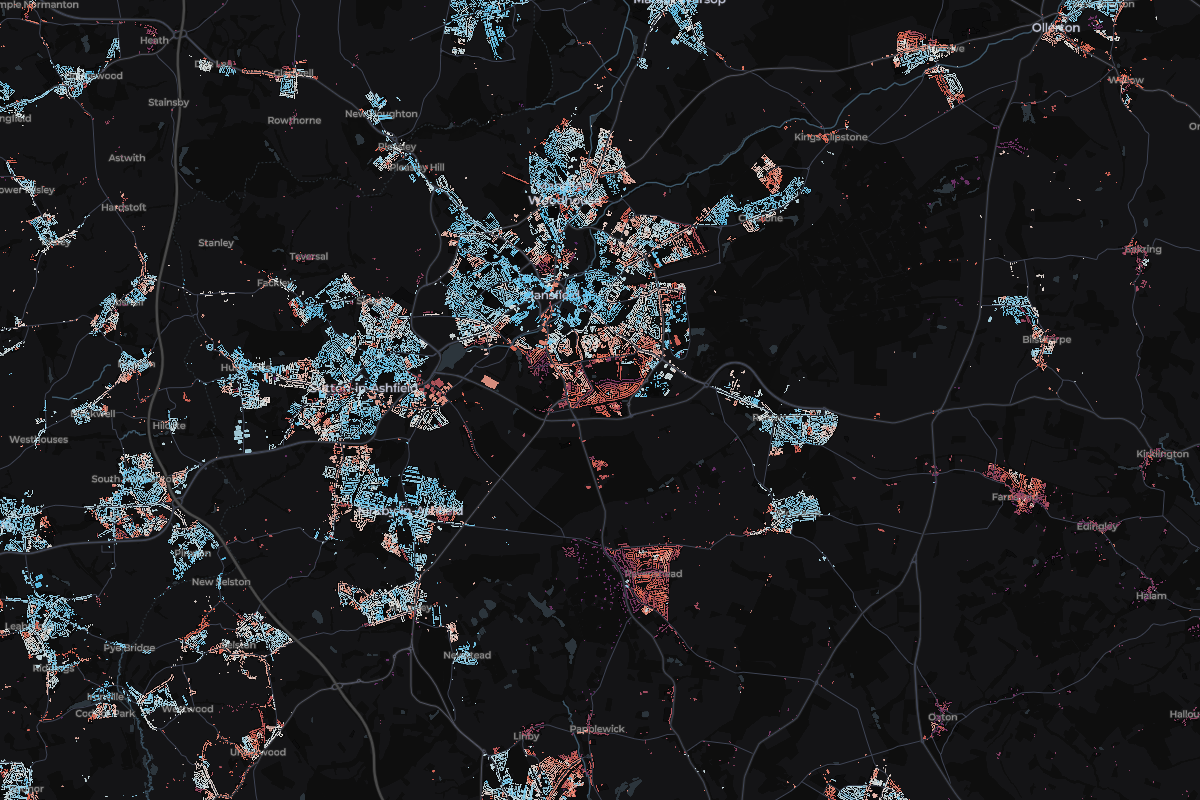
Tap any home in Mansfield to see what it sold for.
Most expensive homes in Mansfield
Sold Oct 2025 – Sept 2026. Tap a home to see it on the map.
- 110 High Oakham ParkDetached · Feb 2026£1,500,000
- 218 Black Scotch LaneDetached · Dec 2025£790,000
- 3Orchard House, High Oakham RoadDetached · Mar 2026£696,250
- 4102 Chatsworth DriveDetached · Jun 2026£665,000
- 56 The AvenueDetached · Jun 2026£632,000
Show 5 moreShow the top 5 only
Most expensive streets in Mansfield
Median sold price of streets with 3 or more home sales. Tap a street to see it on the map.
- 1Lime GroveForest Town£575,0003 sales
- 2Chatsworth DriveMansfield£422,5005 sales
- 3Parkland CloseMansfield£392,5003 sales
- 4The GrangeMansfield£387,5006 sales
- 5Nottingham RoadMansfield£380,0005 sales
Show 5 moreShow the top 5 only
- England
£285,000
676,259 sales
- Nottinghamshire
£220,000
14,560 sales
Mansfield
£180,000
1,422 sales
- Change across the window
- -6.8%
- Sales
- 1,422
- Share of Nottinghamshire
- 10%
8 of 8 places in Nottinghamshire, by median
Median sold prices in Mansfield, compared with the wider area
- England
- Nottinghamshire
- Mansfield
Property type
Bar length is the share of sales. The price is the median.
- Detached£275,000473 sales
- Semi-detached£172,750518 sales
- Terraced£118,000330 sales
- Flat£103,00061 sales
- Other£231,00040 sales
Price spread
Lower and upper quartile. The mark is the median.
£128,000£250,000
How the sales split
- Freehold95% 1,351 sales
- Leasehold5% 71 sales
- New build3% 42 sales
Places in Mansfield
From most to least expensive.