Burnley house prices
Homes in Burnley sold for a median of £123,000, from 1,479 sales, Oct 2025 – Sept 2026.
The median is £67,000 below Lancashire. Sold prices from HM Land Registry, not valuations.
Burnley house prices map
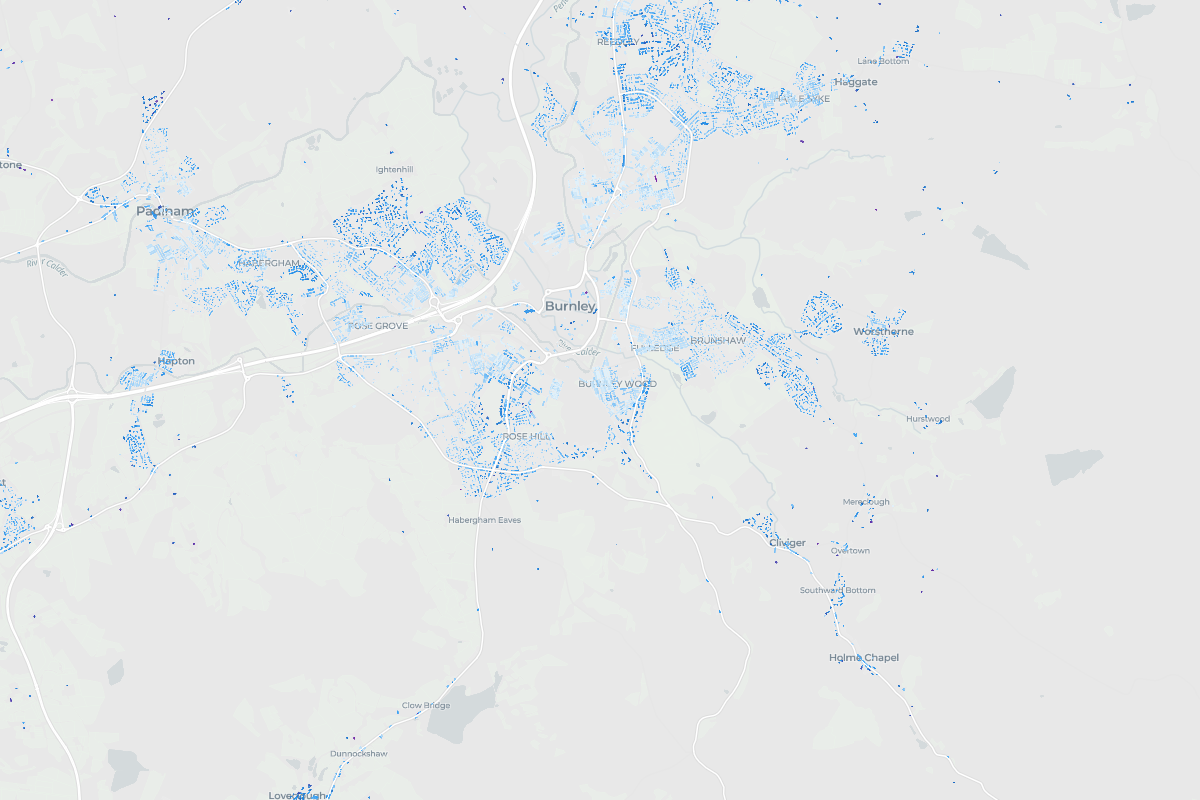
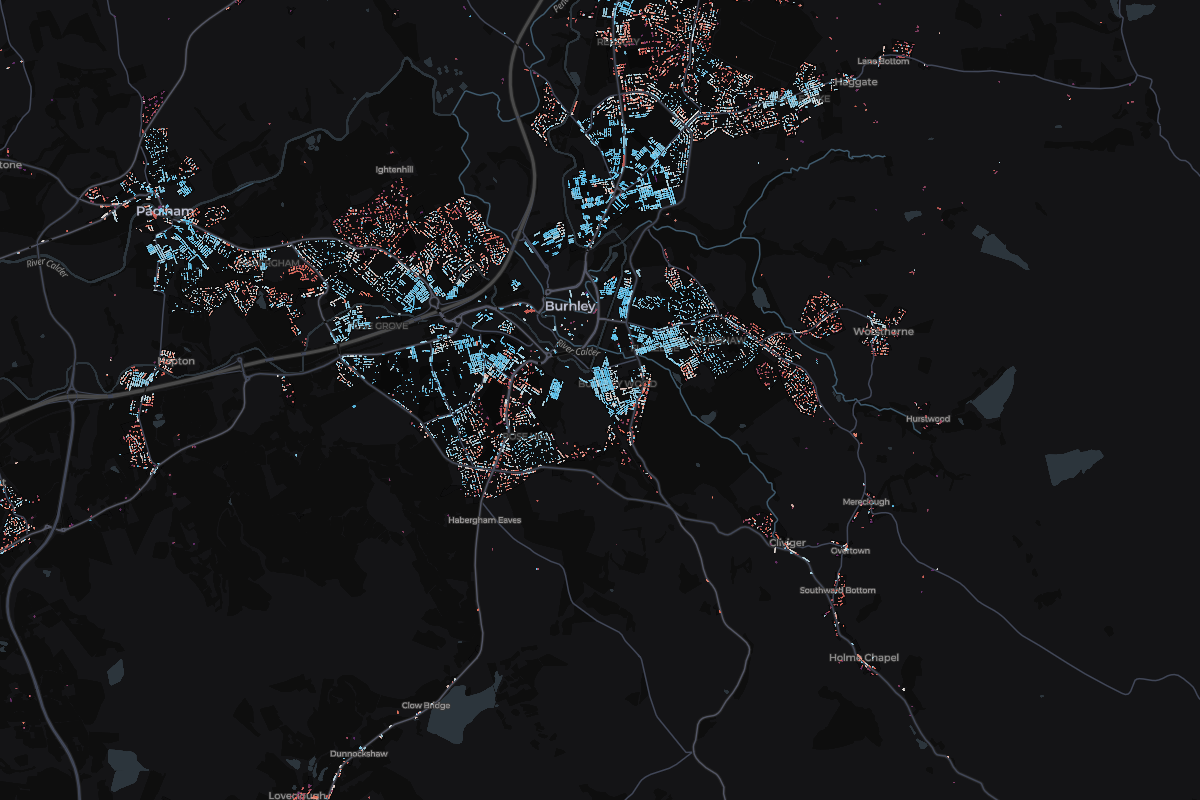
Tap any home in Burnley to see what it sold for.
Most expensive homes in Burnley
Sold Oct 2025 – Sept 2026. Tap a home to see it on the map.
- 1Royle Hall Farm, RoyleDetached · Feb 2026£935,000
- 269 Red Lees RoadDetached · Jun 2026£695,000
- 3346 Burnley RoadDetached · Cliviger · Aug 2026£636,500
- 4Hill Crest, Pasturegate AvenueSemi-detached · Dec 2025£515,000
- 52 Spenser CloseDetached · Worsthorne · Sept 2026£505,000
Show 5 moreShow the top 5 only
Most expensive streets in Burnley
Median sold price of streets with 3 or more home sales. Tap a street to see it on the map.
- 1Cumbrian WayBurnley£396,2504 sales
- 2Buttercross CloseBurnley£325,0003 sales
- 3Red Lees RoadBurnley£325,0003 sales
- 4Colvin WayBurnley£305,2504 sales
- 5Foster DriveBurnley£302,0004 sales
Show 5 moreShow the top 5 only
- 6Rochester DriveBurnley£290,0003 sales
- 7Ribblesdale AvenueWorsthorne£280,0004 sales
- 8Cunliffe DriveBurnley£262,5005 sales
- 9Founders CloseBurnley£255,7504 sales
- 10Brantfell DriveBurnley£253,7504 sales
- England
£285,000
676,259 sales
- Lancashire
£190,000
17,781 sales
Burnley
£123,000
1,479 sales
- Change across the window
- -11.1%
- Sales
- 1,479
- Share of Lancashire
- 8%
12 of 12 places in Lancashire, by median
Median sold prices in Burnley, compared with the wider area
- England
- Lancashire
- Burnley
Property type
Bar length is the share of sales. The price is the median.
- Detached£292,750180 sales
- Semi-detached£181,000327 sales
- Terraced£85,000847 sales
- Flat£86,00053 sales
- Other£160,00072 sales
Price spread
Lower and upper quartile. The mark is the median.
£75,750£195,000
How the sales split
- Freehold37% 552 sales
- Leasehold63% 927 sales
- New build1% 12 sales