Hillingdon house prices
Homes in Hillingdon sold for a median of £500,000, from 2,405 sales, Oct 2025 – Sept 2026.
The median matches Greater London. Sold prices from HM Land Registry, not valuations.
Hillingdon house prices map
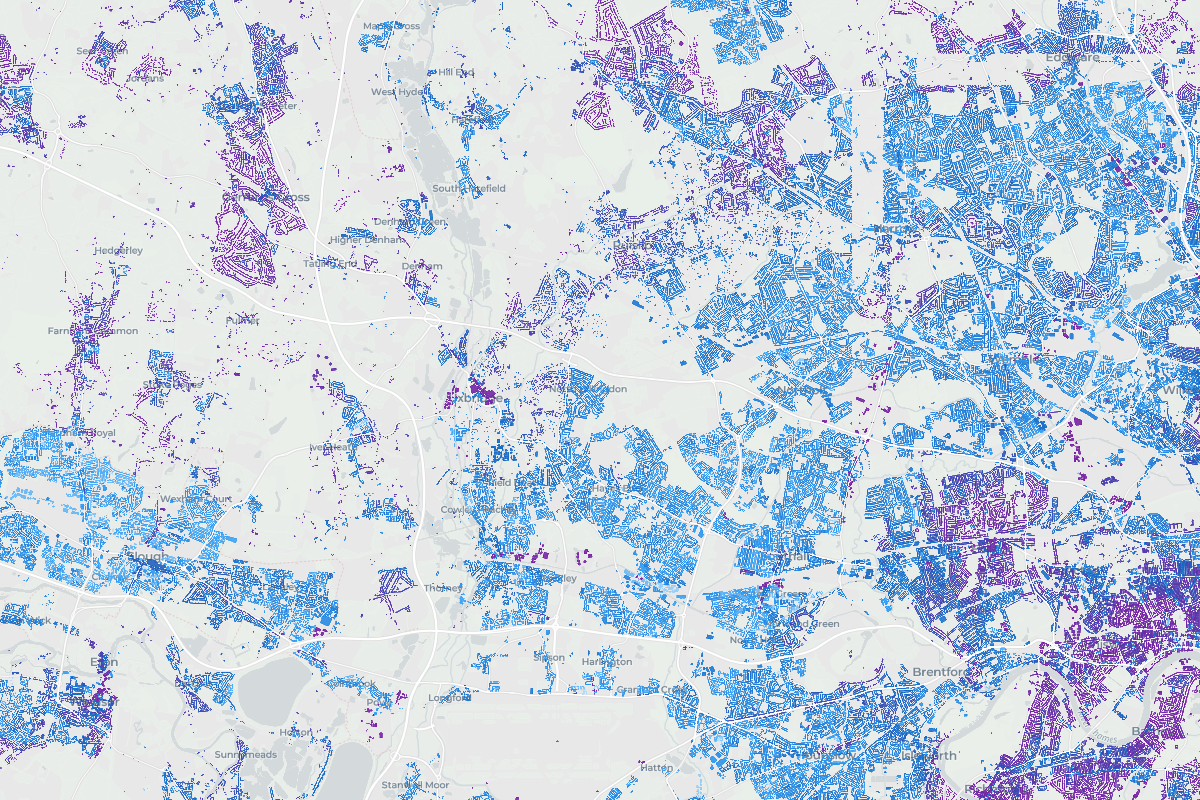
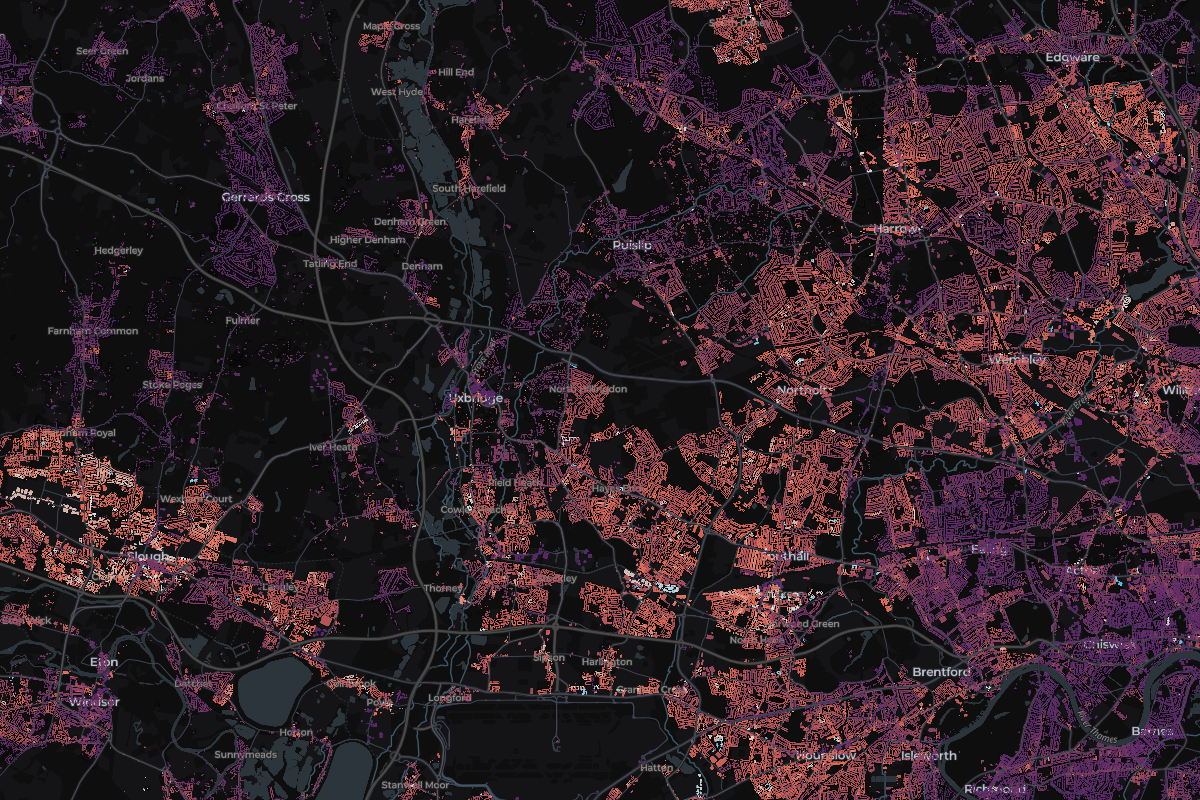
Tap any home in Hillingdon to see what it sold for.
Most expensive homes in Hillingdon
Sold Oct 2025 – Sept 2026. Tap a home to see it on the map.
- 13 The BroadwalkDetached · Northwood · May 2026£5,100,000
- 233a The DriveDetached · Ickenham · Dec 2025£3,000,000
- 311 Moor Park RoadDetached · Northwood · Apr 2026£2,800,000
- 447 The DriveDetached · Ickenham · Oct 2025£2,725,000
- 51, Ducks Hill Grange, Ducks Hill RoadSemi-detached · Northwood · Mar 2026£2,500,000
Show 5 moreShow the top 5 only
Most expensive streets in Hillingdon
Median sold price of streets with 3 or more home sales. Tap a street to see it on the map.
- 1The DriveIckenham£2,725,0003 sales
- 2The AvenueNorthwood£1,325,0005 sales
- 3Park AvenueRuislip£1,120,0007 sales
- 4Green LaneNorthwood£1,120,0004 sales
- 5Abbotsbury GardensPinner£1,000,0003 sales
Show 5 moreShow the top 5 only
- England
£285,000
676,259 sales
- Greater London
£500,000
74,374 sales
Hillingdon
£500,000
2,405 sales
- Change across the window
- +0.5%
- Sales
- 2,405
- Share of Greater London
- 3%
21 of 33 places in Greater London, by median
Median sold prices in Hillingdon, compared with the wider area
- England
- Greater London
- Hillingdon
Property type
Bar length is the share of sales. The price is the median.
- Detached£825,000288 sales
- Semi-detached£550,000804 sales
- Terraced£488,500592 sales
- Flat£295,000649 sales
- Other£635,00072 sales
Price spread
Lower and upper quartile. The mark is the median.
£360,000£610,000
How the sales split
- Freehold71% 1,711 sales
- Leasehold29% 694 sales
- New build1% 21 sales
Places in Hillingdon
From most to least expensive.