Burton On Trent house prices
Homes in Burton On Trent sold for a median of £292,000, from 59 sales, Oct 2025 – Sept 2026.
The median is £47,000 above South Derbyshire. Sold prices from HM Land Registry, not valuations.
Burton On Trent house prices map
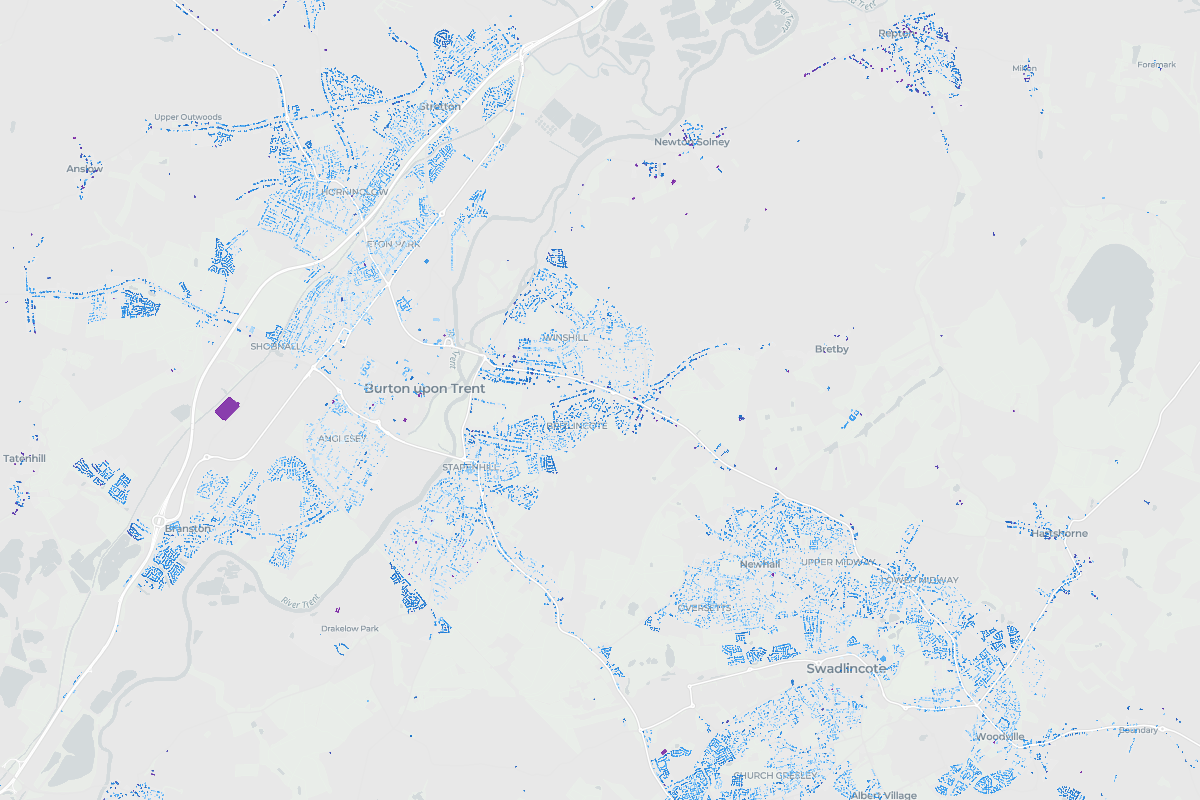
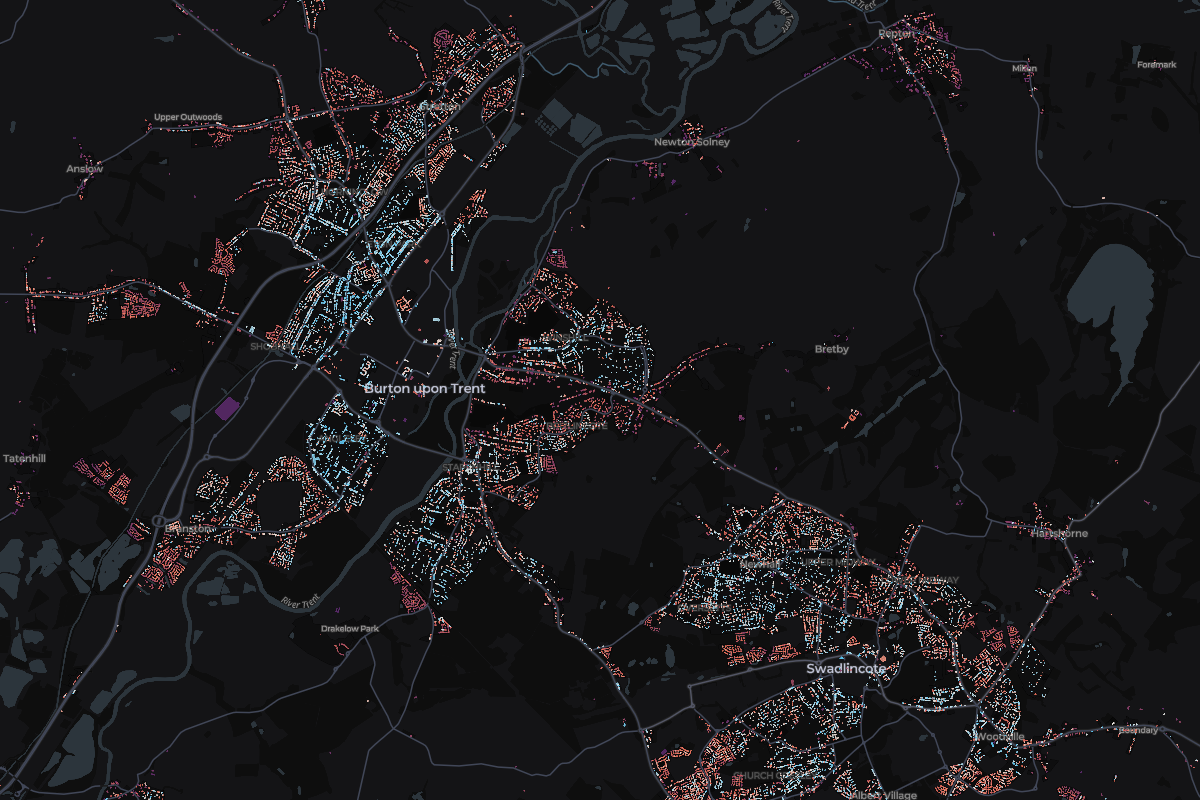
Tap any home in Burton On Trent to see what it sold for.
Most expensive homes in Burton On Trent
Sold Oct 2025 – Sept 2026. Tap a home to see it on the map.
- 13, Primavera, Trent LaneDetached · Newton Solney · Nov 2025£820,000
- 211 Hoskins LaneDetached · Newton Solney · Nov 2025£530,000
- 342 Marley WayDetached · Drakelow · Jun 2026£510,000
- 44 St Marys CloseDetached · Newton Solney · Oct 2025£500,000
- 5Eight Bells, Repton RoadDetached · Newton Solney · Nov 2025£470,000
Show 5 moreShow the top 5 only
Most expensive streets in Burton On Trent
Median sold price of streets with 3 or more home sales. Tap a street to see it on the map.
- 1Bretby LaneBretby£410,0003 sales
- 2Thorneywood RoadDrakelow£307,5003 sales
- 3Eaves CloseDrakelow£302,9953 sales
- 4Galloway RoadDrakelow£250,0003 sales
- 5Woodland RoadStanton£177,0003 sales
- England
£285,000
676,259 sales
- Derbyshire
£225,000
11,418 sales
- South Derbyshire
£245,000
1,658 sales
Burton On Trent
£292,000
59 sales
- Change across the window
- -22.4%
- Sales
- 59
- Share of South Derbyshire
- 4%
11 of 19 places in South Derbyshire, by median
Median sold prices in Burton On Trent, compared with the wider area
- England
- Derbyshire
- South Derbyshire
- Burton On Trent
Property type
Bar length is the share of sales. The price is the median.
- Detached£350,00031 sales
- Semi-detached£237,50018 sales
- Terraced£185,5008 sales
- FlatNot enough sales2 sales
Price spread
Lower and upper quartile. The mark is the median.
£220,000£362,997
How the sales split
- Freehold88% 52 sales
- Leasehold12% 7 sales
- New build15% 9 sales
Places in Burton On Trent
From most to least expensive.