Ripley house prices
Homes in Ripley sold for a median of £205,000, from 347 sales, Oct 2025 – Sept 2026.
The median is £15,000 below Amber Valley. Sold prices from HM Land Registry, not valuations.
Ripley house prices map
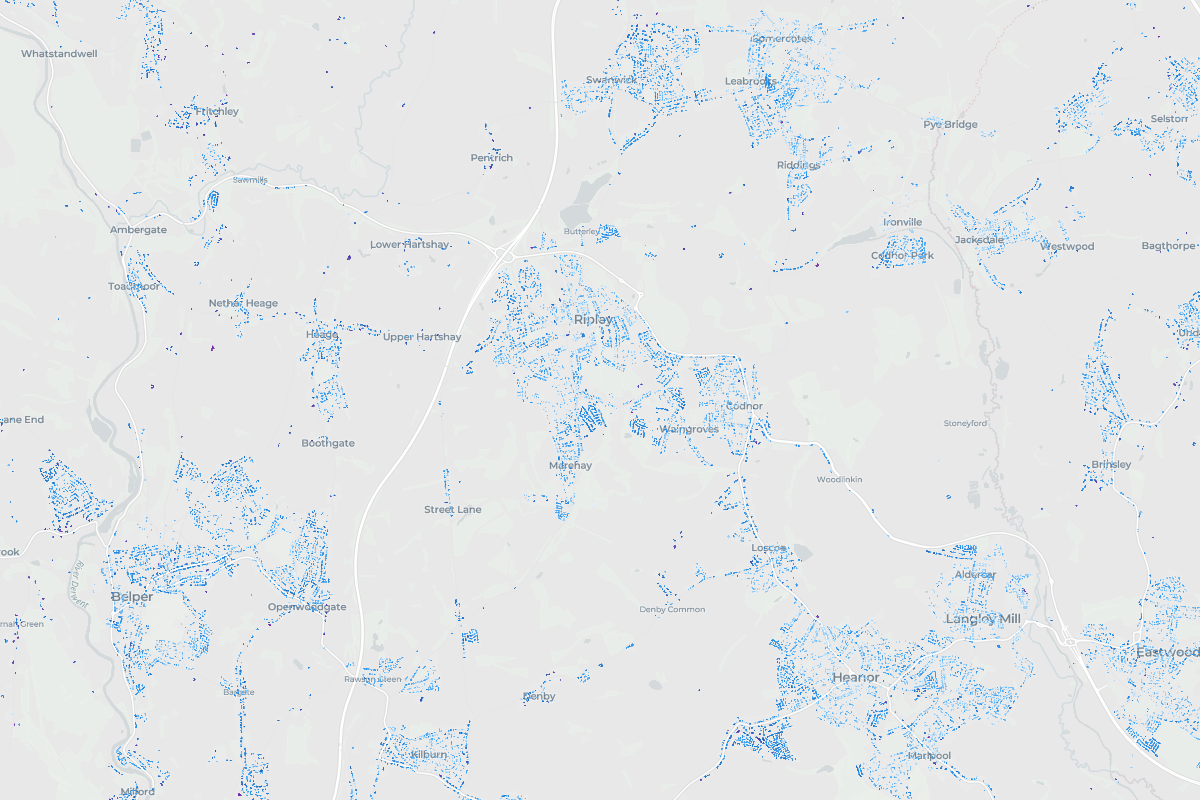
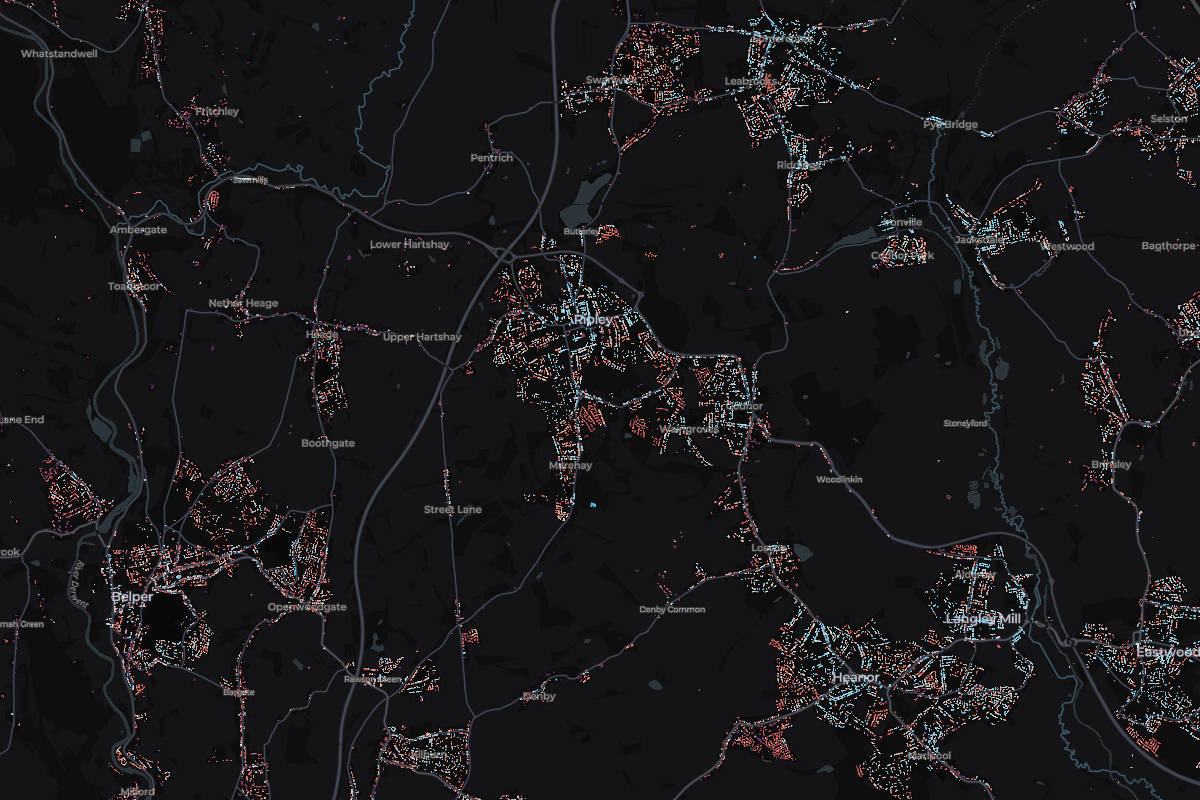
Tap any home in Ripley to see what it sold for.
Most expensive homes in Ripley
Sold Oct 2025 – Sept 2026. Tap a home to see it on the map.
- 1White House, Main RoadDetached · Pentrich · Oct 2025£830,000
- 2The Cottage, Post Office Farm, 215 Church StreetDetached · Denby Village · Oct 2025£660,000
- 310 Bridle LaneDetached · Lower Hartshay · Nov 2025£660,000
- 49 Parsons GroveDetached · Denby Village · Jul 2026£562,500
- 5253 Heage RoadDetached · Nov 2025£560,000
Show 5 moreShow the top 5 only
- 636 Flamstead LaneDetached · Denby Village · Oct 2025£550,000
- 712 Church StreetDetached · Denby Village · Dec 2025£451,000
- 835 Middleton AvenueDetached · Codnor · Apr 2026£450,000
- 9Rosebank, Asher LaneDetached · Pentrich · Jun 2026£450,000
- 104 Chancel WayDetached · New build · Oct 2025£440,000
Most expensive streets in Ripley
Median sold price of streets with 3 or more home sales. Tap a street to see it on the map.
- England
£285,000
676,259 sales
- Derbyshire
£225,000
11,418 sales
- Amber Valley
£220,000
1,836 sales
Ripley
£205,000
347 sales
- Change across the window
- -2.4%
- Sales
- 347
- Share of Amber Valley
- 19%
6 of 10 places in Amber Valley, by median
Median sold prices in Ripley, compared with the wider area
- England
- Derbyshire
- Amber Valley
- Ripley
Property type
Bar length is the share of sales. The price is the median.
- Detached£275,000114 sales
- Semi-detached£195,000107 sales
- Terraced£159,950102 sales
- FlatNot enough sales5 sales
- Other£375,00019 sales
Price spread
Lower and upper quartile. The mark is the median.
£159,950£267,500
How the sales split
- Freehold97% 335 sales
- Leasehold3% 12 sales
- New build2% 6 sales