Blackpool house prices
Homes in Blackpool sold for a median of £132,500, from 2,202 sales, Oct 2025 – Sept 2026.
The median is £152,500 below England. Sold prices from HM Land Registry, not valuations.
Blackpool house prices map
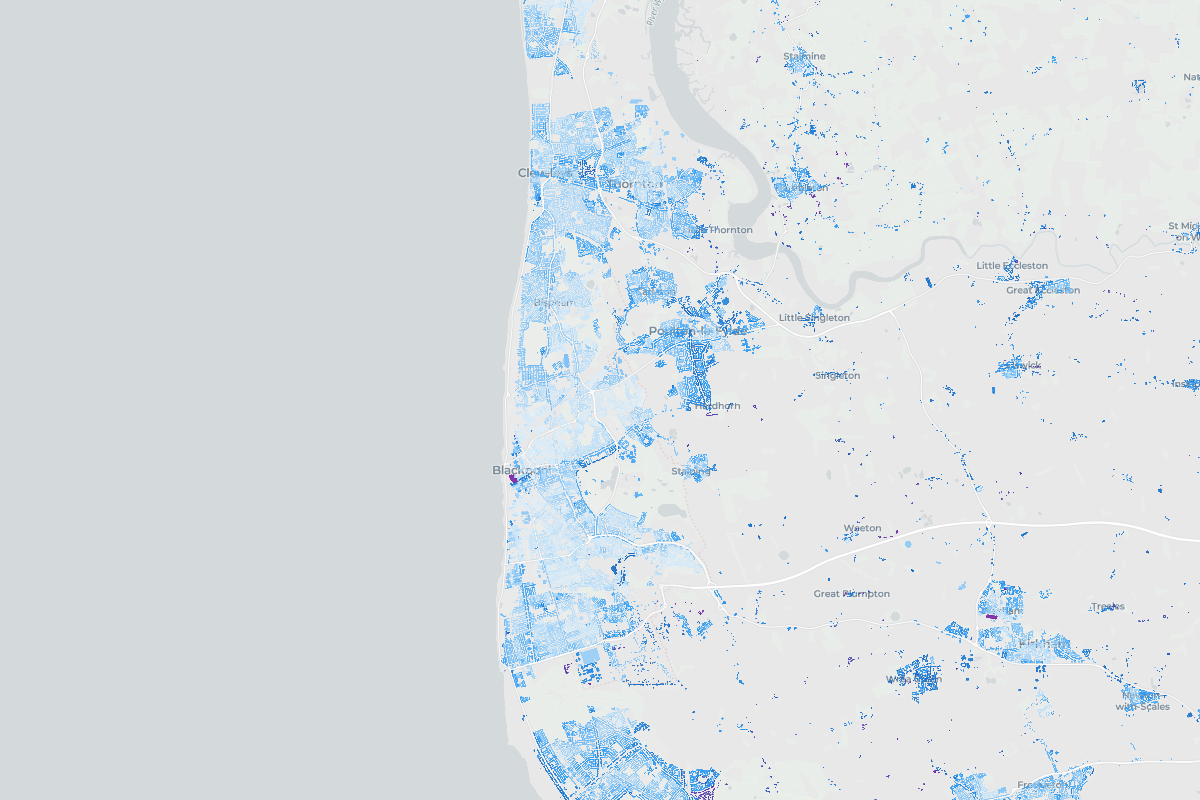
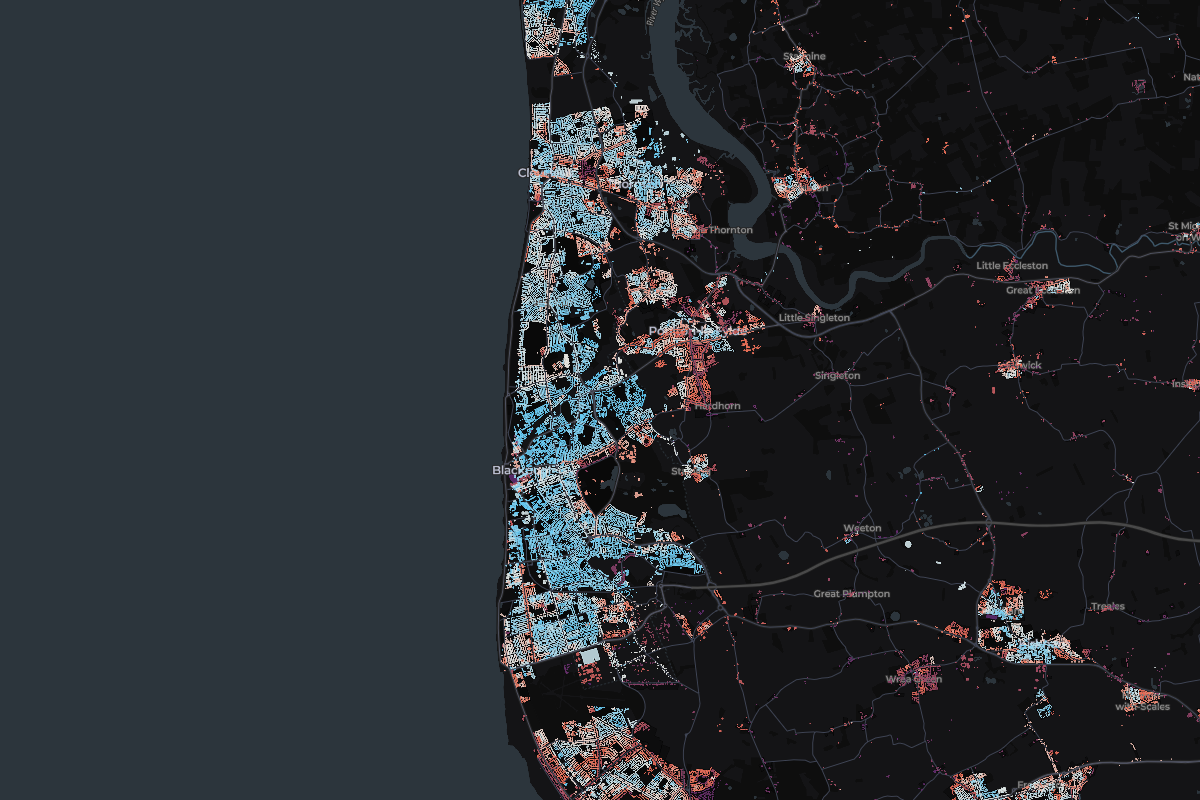
Tap any home in Blackpool to see what it sold for.
Most expensive homes in Blackpool
Sold Oct 2025 – Sept 2026. Tap a home to see it on the map.
- 124, Oakwood House, Robins LaneDetached · Poulton Le Fylde · Oct 2025£665,000
- 241 North Park DriveDetached · Nov 2025£550,000
- 347 NorthgateDetached · Bispham · Aug 2026£475,000
- 42 The KnowleDetached · Bispham · Mar 2026£470,000
- 570 Warbreck Hill RoadDetached · Apr 2026£465,000
Show 5 moreShow the top 5 only
Most expensive streets in Blackpool
Median sold price of streets with 3 or more home sales. Tap a street to see it on the map.
- 1Champagne AvenueThornton Cleveleys£375,0003 sales
- 2Faraday DriveBispham£332,5004 sales
- 3Redwood BoulevardBlackpool£314,0003 sales
- 4Fleetwood RoadThornton Cleveleys£285,2504 sales
- 5Plovers WayBlackpool£285,0003 sales
Show 5 moreShow the top 5 only
- England
£285,000
676,259 sales
Blackpool
£132,500
2,202 sales
- Change across the window
- -15.4%
- Sales
- 2,202
- Share of England
- 0.33%
85 of 88 places in England, by median
Median sold prices in Blackpool, compared with the wider area
- England
- Blackpool
Property type
Bar length is the share of sales. The price is the median.
- Detached£260,000199 sales
- Semi-detached£158,000863 sales
- Terraced£106,000877 sales
- Flat£80,000170 sales
- Other£144,00093 sales
Price spread
Lower and upper quartile. The mark is the median.
£95,000£175,000
How the sales split
- Freehold88% 1,933 sales
- Leasehold12% 269 sales
- New build0% 7 sales
Places in Blackpool
From most to least expensive.