Fulford house prices
Homes in Fulford sold for a median of £306,500, from 46 sales, Oct 2025 – Sept 2026.
The median is £6,500 above York. Sold prices from HM Land Registry, not valuations.
Fulford house prices map
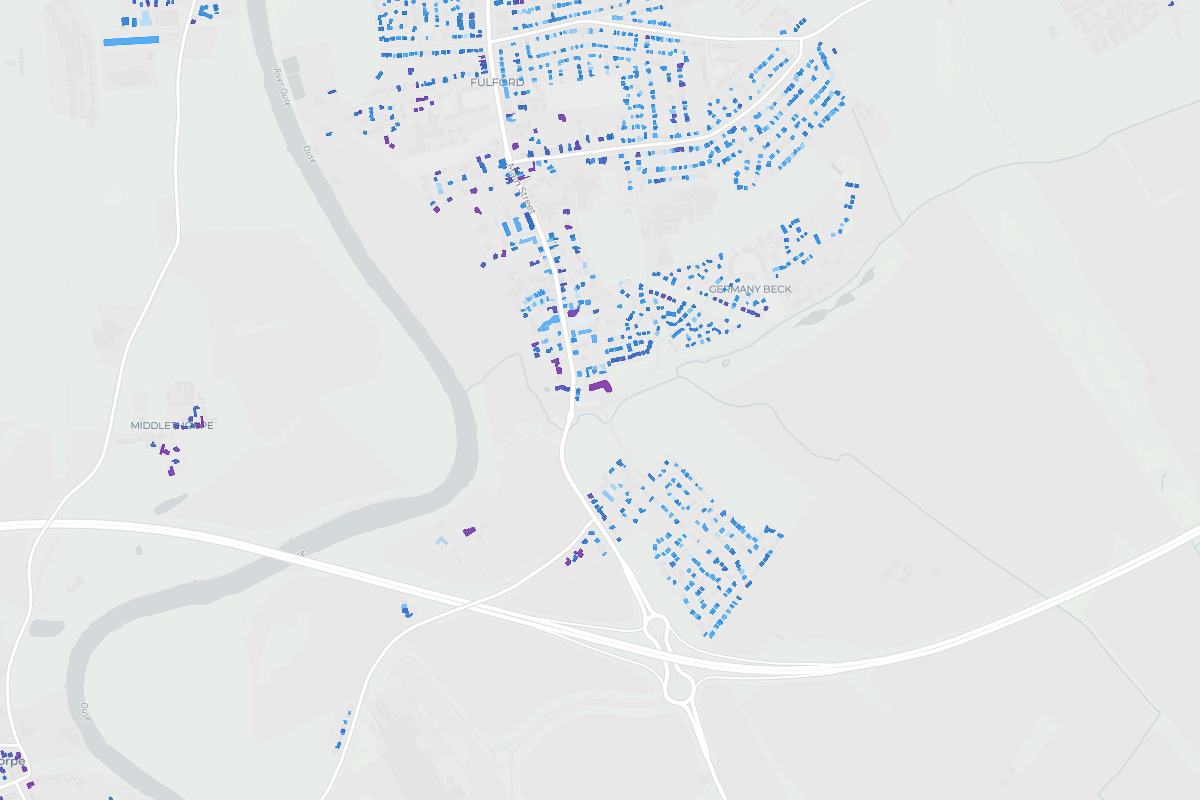
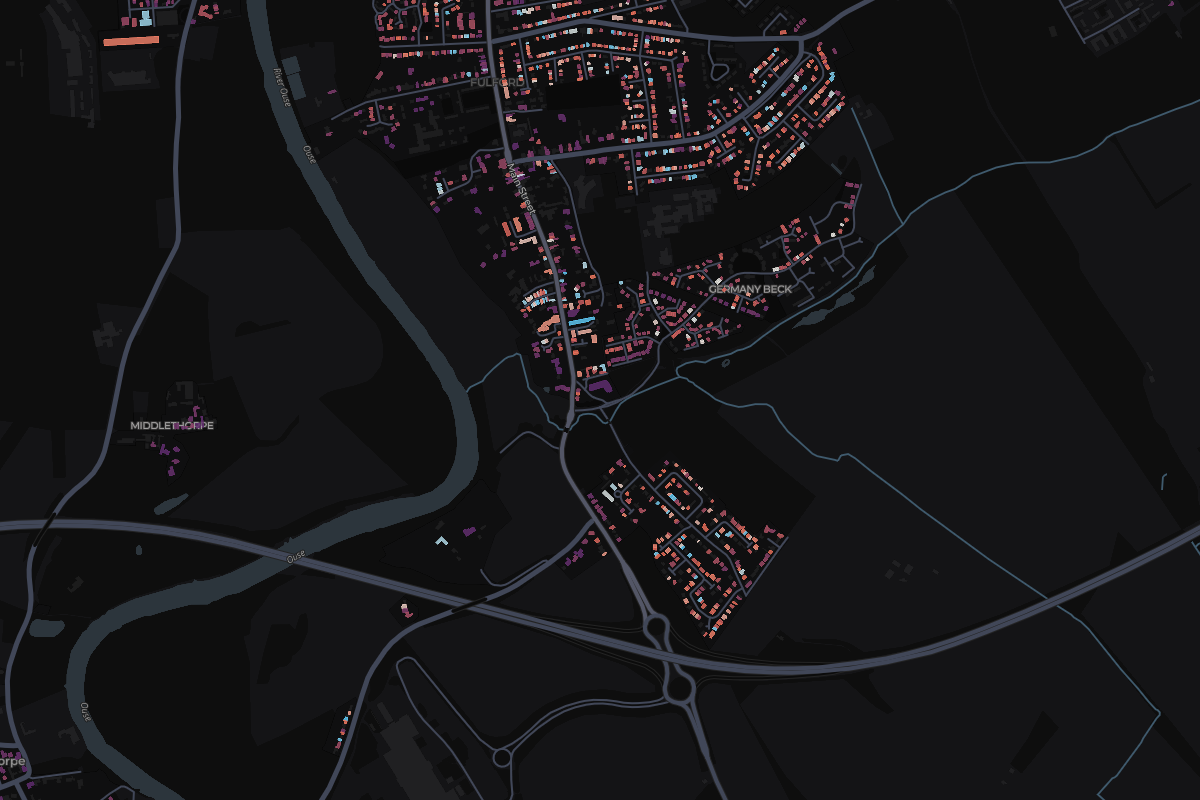
Tap any home in Fulford to see what it sold for.
Most expensive homes in Fulford
Sold Oct 2025 – Sept 2026. Tap a home to see it on the map.
- 1Dove Cote Gardens, Naburn LaneDetached · Dec 2025£1,150,000
- 24 Pasture Farm CloseDetached · Nov 2025£745,000
- 356 School LaneDetached · May 2026£600,000
- 411 Cornwall DriveSemi-detached · Mar 2026£464,000
- 59 Ribble WayDetached · New build · Nov 2025£450,000
Show 5 moreShow the top 5 only
- 634 Ribble WayDetached · New build · Nov 2025£440,000
- 765 Risedale DriveDetached · Mar 2026£430,000
- 811 Eller LaneDetached · Aug 2026£420,000
- 93 East Moor GardensDetached · Aug 2026£410,000
- 1022 Heslington CroftSemi-detached · May 2026£391,000
Most expensive streets in Fulford
From most to least expensive. Tap a street to see it on the map.
- Main Street£525,0004 sales
- Risedale Drive£395,0003 sales
- Cherry Wood Crescent£359,0002 sales
- Ribble Way£330,91810 sales
- Bishopdale Way£325,0003 sales
- Prospect Terrace£292,5003 sales
- Thornton Road£275,0005 sales
- St Oswalds Court£211,2502 sales
- Change across the window
- -3.7%
- Sales
- 46
- Share of York
- 2%
12 of 20 places in York, by median
Median sold prices in Fulford, compared with the wider area
- England
- York
- Fulford
Property type
Bar length is the share of sales. The price is the median.
- Detached£435,00012 sales
- Semi-detached£302,04320 sales
- Terraced£280,00010 sales
- FlatNot enough sales3 sales
- OtherNot enough sales1 sales
Price spread
Lower and upper quartile. The mark is the median.
£275,000£406,250
How the sales split
- Freehold91% 42 sales
- Leasehold9% 4 sales
- New build26% 12 sales