Fallings Park house prices
Fallings Park had 6 sales, Oct 2025 – Sept 2026. That is too few for a median price.
Sold prices from HM Land Registry, not valuations.
Fallings Park house prices map
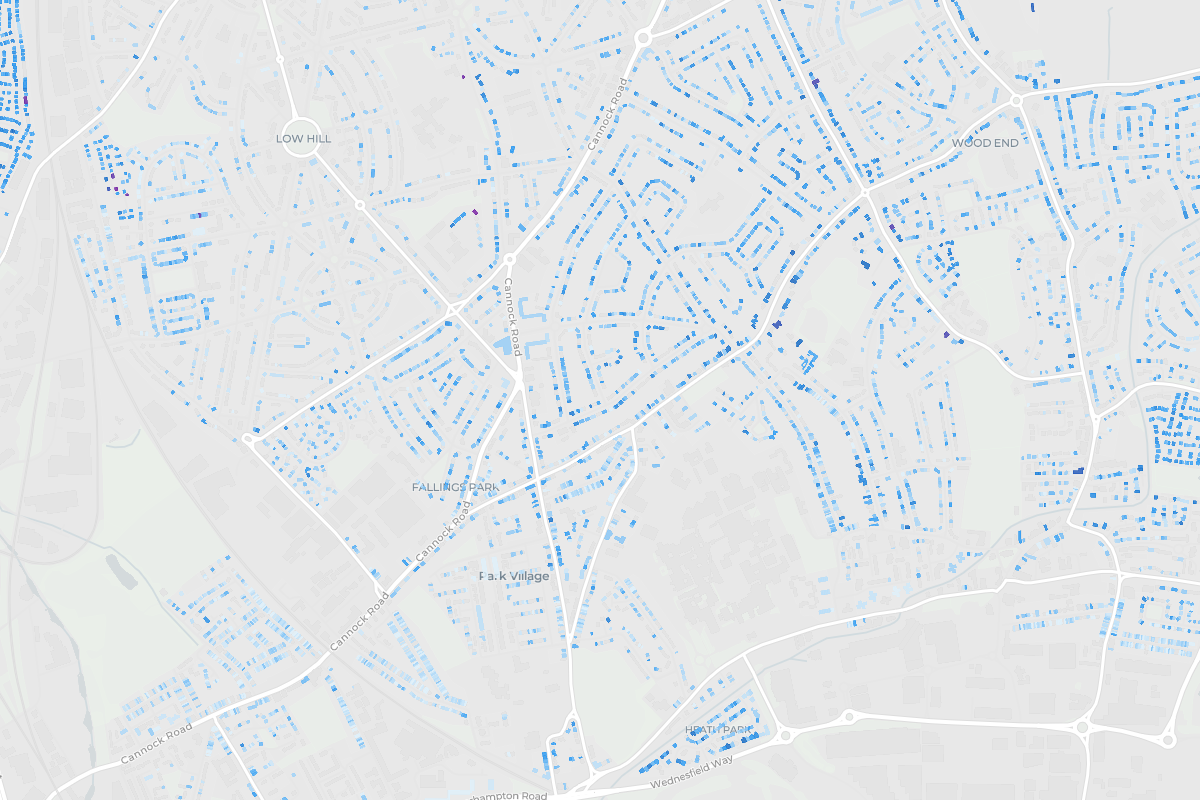
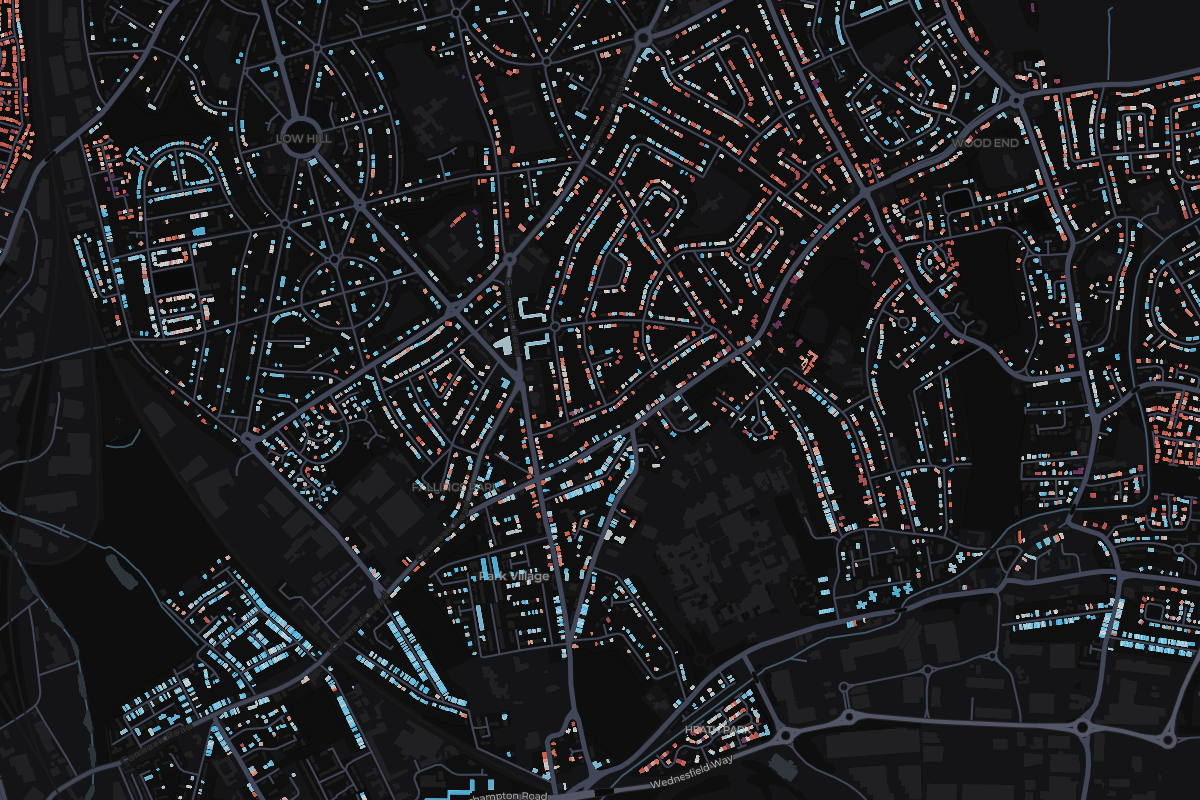
Tap any home in Fallings Park to see what it sold for.
Most expensive homes in Fallings Park
Sold Oct 2025 – Sept 2026. Tap a home to see it on the map.
- 185 Kingsway RoadSemi-detached · Dec 2025£315,000
- 264 Kingsway RoadSemi-detached · Jun 2026£295,000
- 382 Kingsway RoadSemi-detached · Jun 2026£206,777
- 458 Kingsway RoadSemi-detached · Dec 2025£189,000
- 51 The AvenueTerraced · Dec 2025£180,000
- England
£285,000
676,259 sales
- West Midlands
£230,000
26,689 sales
- Wolverhampton
£215,000
2,199 sales
Fallings Park
Not enough sales
6 sales
- Change across the window
- Not enough sales
- Sales
- 6
- Share of Wolverhampton
- 0.27%
Median sold prices in Fallings Park, compared with the wider area
- England
- West Midlands
- Wolverhampton
- Fallings Park
Property type
Bar length is the share of sales. The price is the median.
- Semi-detachedNot enough sales4 sales
- TerracedNot enough sales1 sales
- FlatNot enough sales1 sales
How the sales split
- Freehold83% 5 sales
- Leasehold17% 1 sales
- New build0% 0 sales
Every home sold in Fallings Park
From most to least expensive. Tap a home to see it on the map.
- 85 Kingsway Road£315,0001 sale
- 64 Kingsway Road£295,0001 sale
- 82 Kingsway Road£206,7771 sale
- 58 Kingsway Road£189,0001 sale
- 1 The Avenue£180,0001 sale
- 12 Princess Court£112,0001 sale