Sheldon house prices
Homes in Sheldon sold for a median of £241,000, from 136 sales, Oct 2025 – Sept 2026.
The median is £11,000 above Birmingham. Sold prices from HM Land Registry, not valuations.
Sheldon house prices map
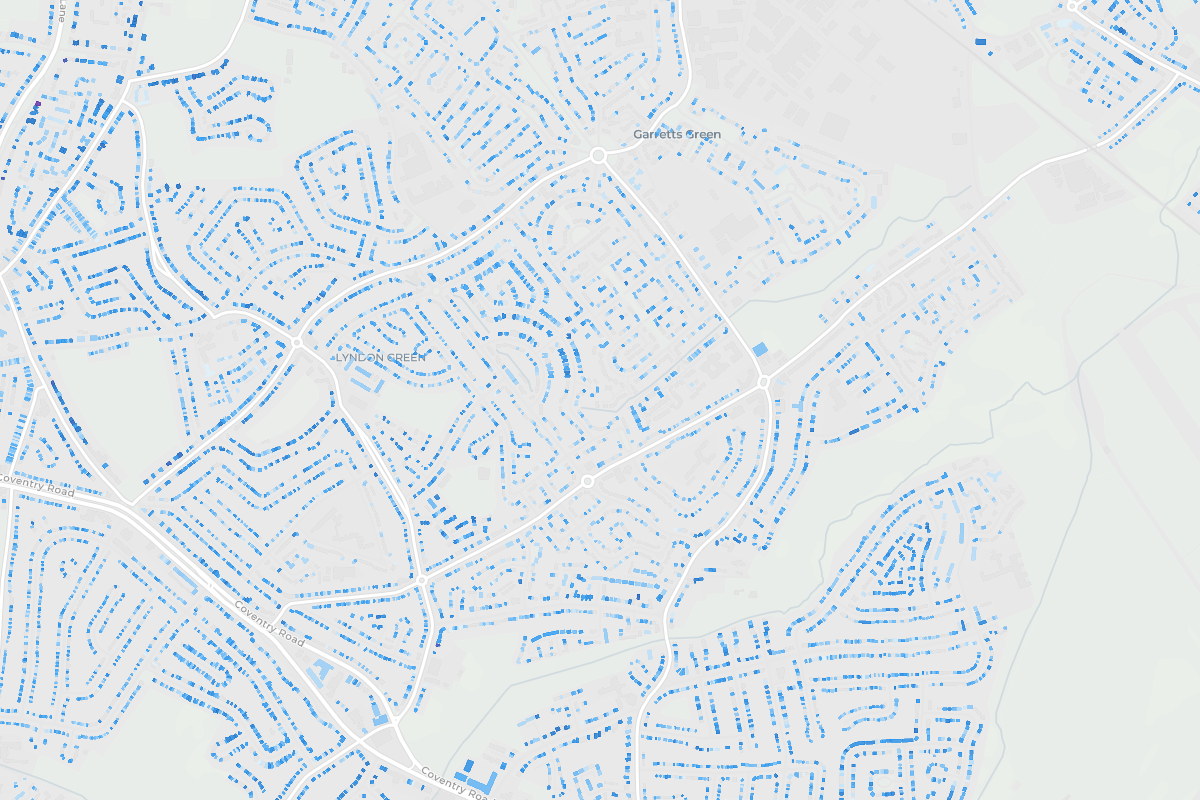
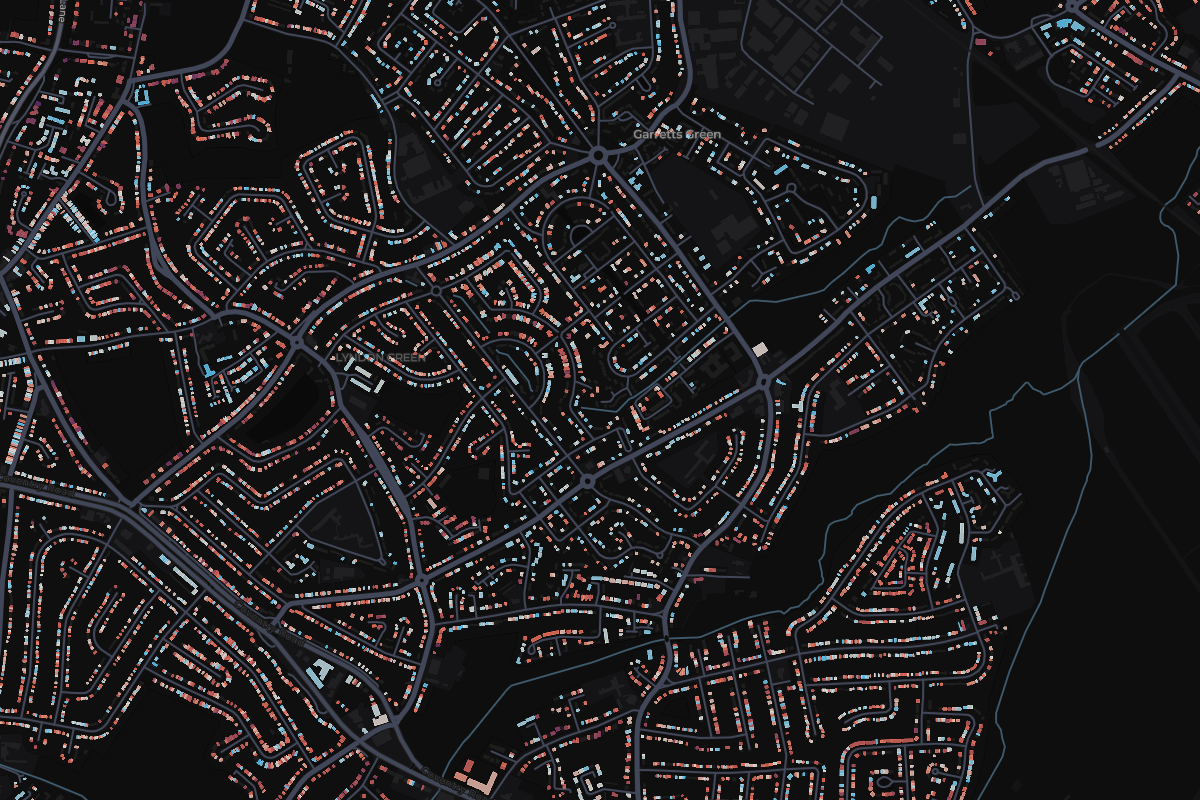
Tap any home in Sheldon to see what it sold for.
Most expensive homes in Sheldon
Sold Oct 2025 – Sept 2026. Tap a home to see it on the map.
- 12471 Coventry RoadSemi-detached · Apr 2026£415,000
- 2106 Olorenshaw RoadSemi-detached · Oct 2025£410,000
- 31 Keswick RoadSemi-detached · May 2026£377,000
- 442 Billingsley RoadSemi-detached · Feb 2026£365,000
- 5100 Common LaneDetached · Aug 2026£357,500
Show 5 moreShow the top 5 only
Most expensive streets in Sheldon
From most to least expensive. Tap a street to see it on the map.
- Olorenshaw Road£350,0003 sales
- Warmington Road£320,0002 sales
- Este Road£287,5002 sales
- Willclare Road£282,5003 sales
- Bayford Avenue£277,5002 sales
- Goldthorne Avenue£268,7504 sales
- Whitecroft Road£268,2508 sales
- Bellevue Road£267,5002 sales
- Ivydale Avenue£261,0004 sales
- Common Lane£255,0005 sales
Show the other 17 streetsShow the top 10 only
- Brays Road£246,5008 sales
- Elmay Road£245,0009 sales
- Berryfield Road£245,0002 sales
- Garretts Green Lane£242,00013 sales
- Coventry Road£238,00019 sales
- New Coventry Road£236,0003 sales
- Rectory Park Road£233,7508 sales
- Garwood Road£233,0002 sales
- Normanton Avenue£231,5004 sales
- Church Road£218,0007 sales
- Westley Brook Close£215,0002 sales
- Horse Shoes Lane£206,5003 sales
- Admington Road£195,0005 sales
- Comberton Road£183,5002 sales
- Hazeldene Road£170,0002 sales
- Campbells Green£149,5002 sales
- Mapledene Road£97,1852 sales
- England
£285,000
676,259 sales
- West Midlands
£230,000
26,689 sales
- Birmingham
£230,000
9,788 sales
Sheldon
£241,000
136 sales
- Change across the window
- +4.3%
- Sales
- 136
- Share of Birmingham
- 1%
13 of 41 places in Birmingham, by median
Median sold prices in Sheldon, compared with the wider area
- England
- West Midlands
- Birmingham
- Sheldon
Property type
Bar length is the share of sales. The price is the median.
- DetachedNot enough sales3 sales
- Semi-detached£250,00088 sales
- Terraced£219,00028 sales
- Flat£137,00011 sales
- OtherNot enough sales6 sales
Price spread
Lower and upper quartile. The mark is the median.
£205,000£270,000
How the sales split
- Freehold84% 114 sales
- Leasehold16% 22 sales
- New build1% 2 sales