Orford house prices
Homes in Orford sold for a median of £171,250, from 92 sales, Oct 2025 – Sept 2026.
The median is £78,750 below Warrington. Sold prices from HM Land Registry, not valuations.
Orford house prices map
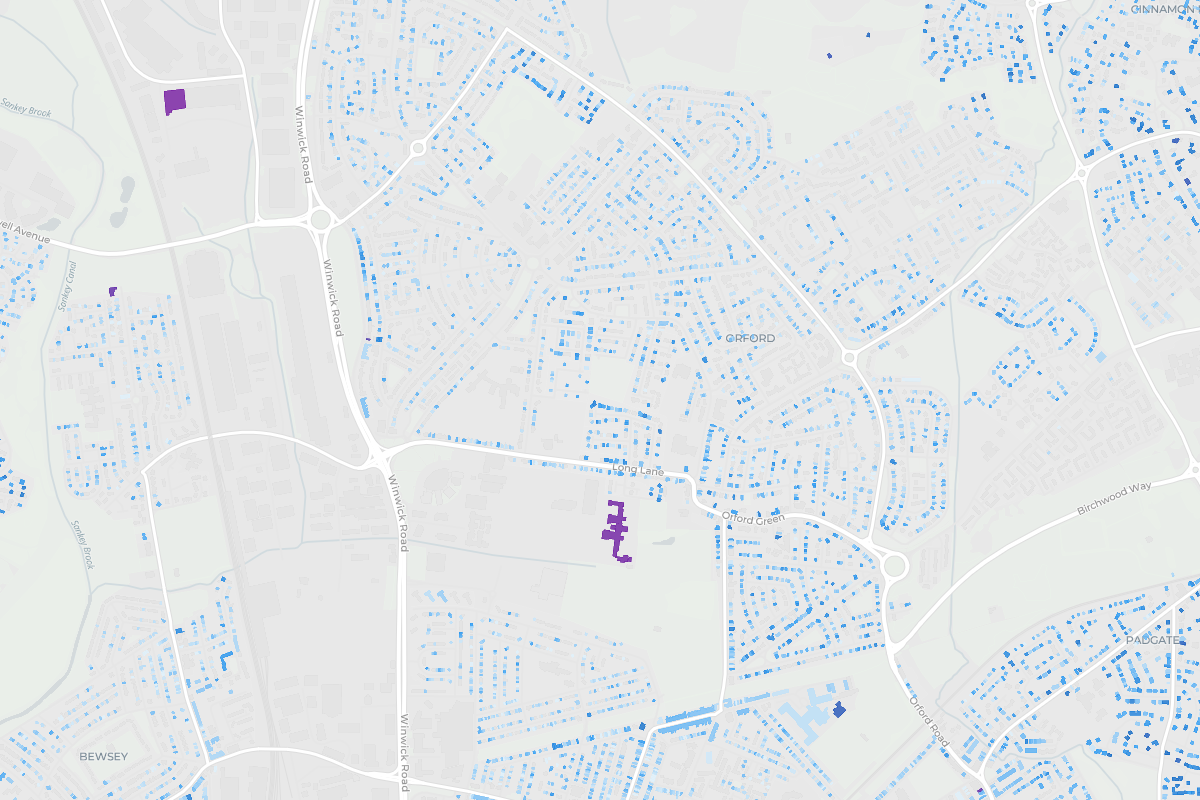
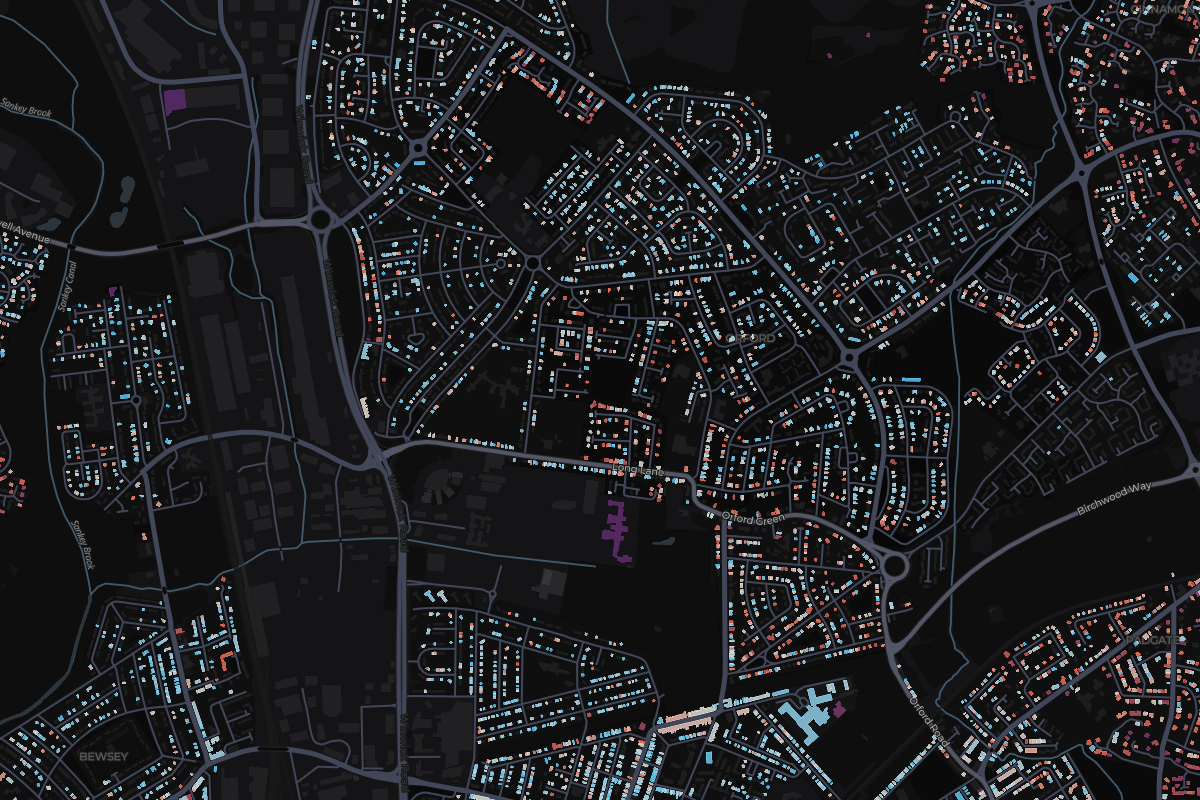
Tap any home in Orford to see what it sold for.
Most expensive homes in Orford
Sold Oct 2025 – Sept 2026. Tap a home to see it on the map.
Most expensive streets in Orford
From most to least expensive. Tap a street to see it on the map.
- Orford Green£716,0002 sales
- Withers Avenue£270,0003 sales
- Halsall Avenue£255,2503 sales
- Capesthorne Road£236,7502 sales
- Neville Avenue£208,0003 sales
- East Avenue£198,0002 sales
- Chiltern Road£189,0002 sales
- Wilkinson Street£187,2502 sales
- Windermere Avenue£185,0005 sales
- Mendip Avenue£185,0003 sales
Show the other 14 streetsShow the top 10 only
- Oxenham Road£180,0002 sales
- Ullswater Avenue£178,0002 sales
- Shaws Avenue£165,0004 sales
- Grisedale Avenue£162,9503 sales
- Honister Avenue£160,0005 sales
- Mardale Avenue£159,0004 sales
- Norris Street£159,0003 sales
- Cotswold Road£156,5004 sales
- Dorothea Street£146,0002 sales
- Rhodes Street£137,5003 sales
- Toll Bar Road£133,0002 sales
- Amelia Street£128,7502 sales
- Ambleside Crescent£121,0002 sales
- Ryfields Village£100,0008 sales
- England
£285,000
676,259 sales
- Warrington
£250,000
2,809 sales
Orford
£171,250
92 sales
- Change across the window
- -14%
- Sales
- 92
- Share of Warrington
- 3%
27 of 27 places in Warrington, by median
Median sold prices in Orford, compared with the wider area
- England
- Warrington
- Orford
Property type
Bar length is the share of sales. The price is the median.
- DetachedNot enough sales4 sales
- Semi-detached£194,00030 sales
- Terraced£169,00047 sales
- FlatNot enough sales7 sales
- OtherNot enough sales4 sales
Price spread
Lower and upper quartile. The mark is the median.
£149,000£206,125
How the sales split
- Freehold53% 49 sales
- Leasehold47% 43 sales
- New build0% 0 sales