Torquay house prices
Homes in Torquay sold for a median of £223,000, from 1,019 sales, Oct 2025 – Sept 2026.
The median is £12,000 below Torbay. Sold prices from HM Land Registry, not valuations.
Torquay house prices map
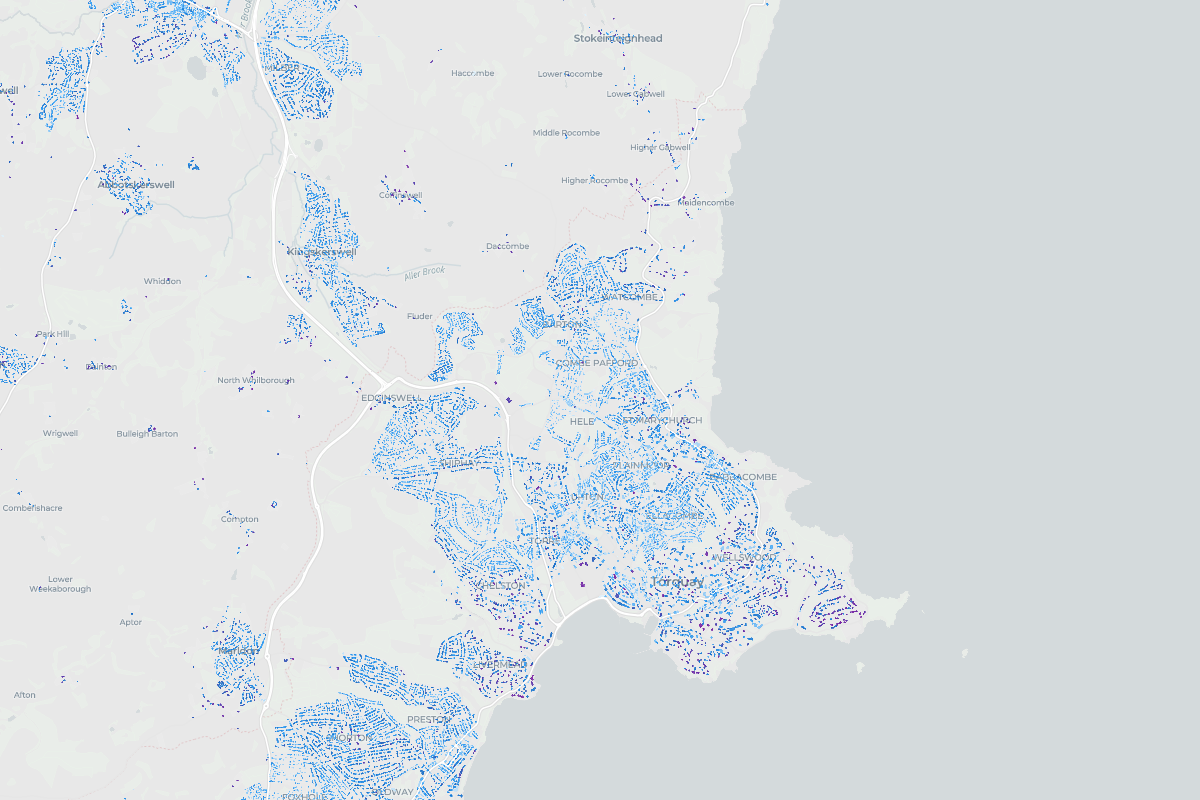
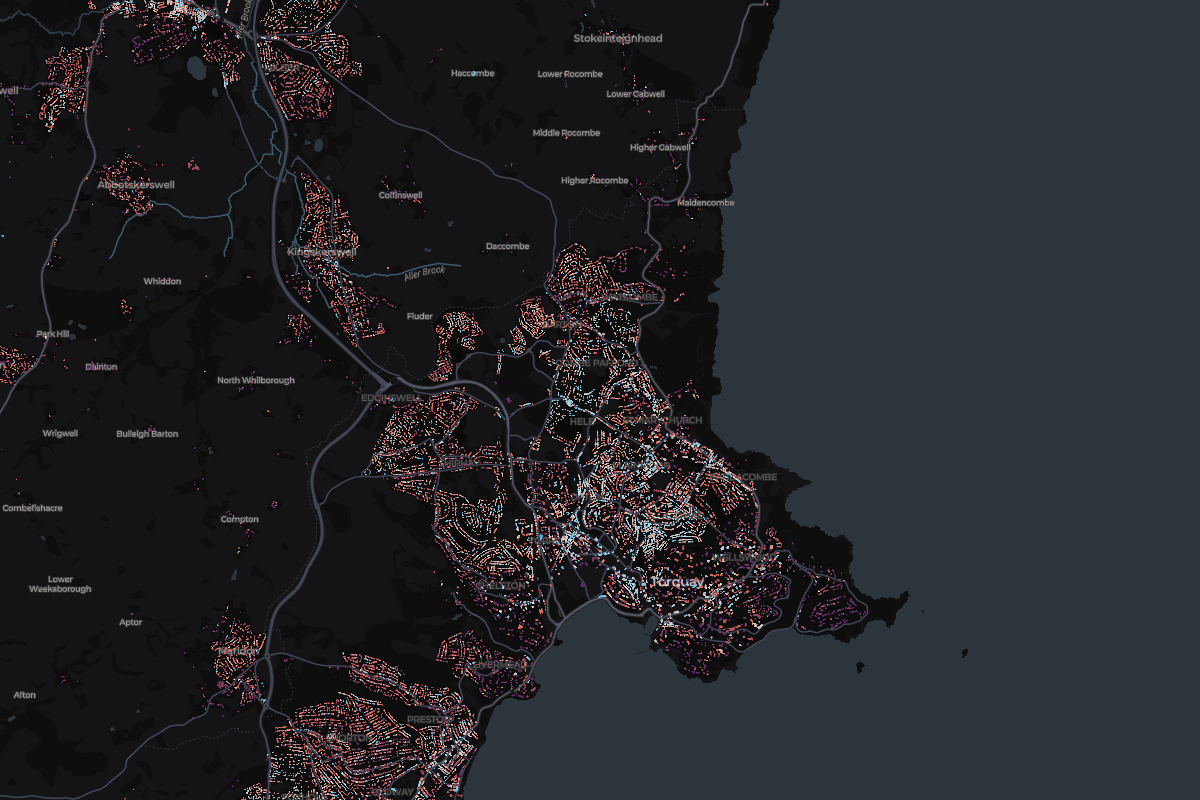
Tap any home in Torquay to see what it sold for.
Most expensive homes in Torquay
Sold Oct 2025 – Sept 2026. Tap a home to see it on the map.
- 1Beau Soleil, 2 Whidborne CloseSemi-detached · Sept 2026£1,200,000
- 2Rowell, Hunsdon RoadDetached · May 2026£1,175,000
- 31, The Dorchesters, Daddyhole RoadDetached · Oct 2025£1,090,000
- 41, Seaview Cottage, Beach RoadSemi-detached · Dec 2025£1,000,000
- 515 Oxlea RoadDetached · Oct 2025£965,000
Show 5 moreShow the top 5 only
- 6Windsong, 25 Whidborne AvenueDetached · Jun 2026£925,000
- 7Seaway Mount, Seaway LaneDetached · Mar 2026£900,000
- 8Rock Edge, Rock End AvenueDetached · May 2026£880,000
- 93 The RivieraTerraced · Nov 2025£858,120
- 10Cuckoo Pit House, Shiphay LaneDetached · Feb 2026£855,000
Most expensive streets in Torquay
Median sold price of streets with 3 or more home sales. Tap a street to see it on the map.
- Change across the window
- +17.5%
- Sales
- 1,019
- Share of Torbay
- 49%
3 of 3 places in Torbay, by median
Median sold prices in Torquay, compared with the wider area
- England
- Torbay
- Torquay
Property type
Bar length is the share of sales. The price is the median.
- Detached£415,000146 sales
- Semi-detached£273,000178 sales
- Terraced£211,295320 sales
- Flat£147,100330 sales
- Other£290,00045 sales
Price spread
Lower and upper quartile. The mark is the median.
£162,500£300,000
How the sales split
- Freehold67% 680 sales
- Leasehold33% 339 sales
- New build2% 18 sales