Hindhead house prices
Homes in Hindhead sold for a median of £500,000, from 73 sales, Oct 2025 – Sept 2026.
The median is £30,000 below Waverley. Sold prices from HM Land Registry, not valuations.
Hindhead house prices map
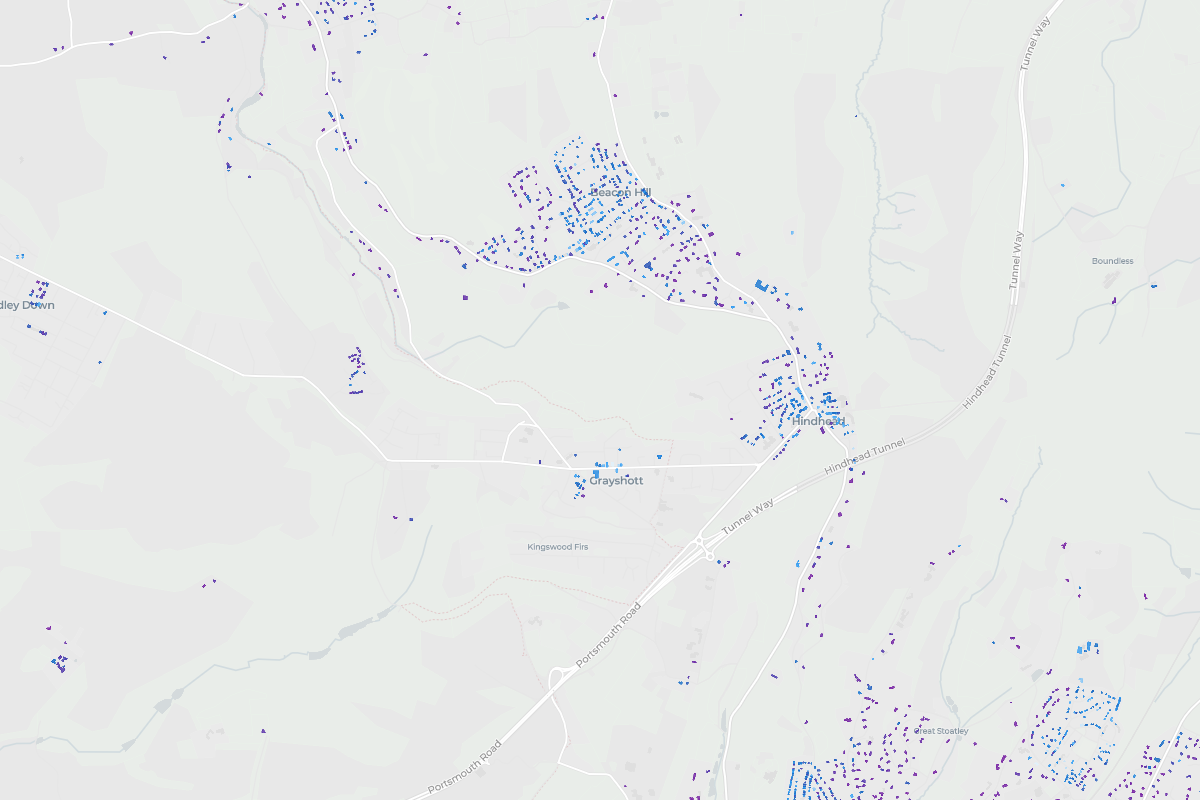
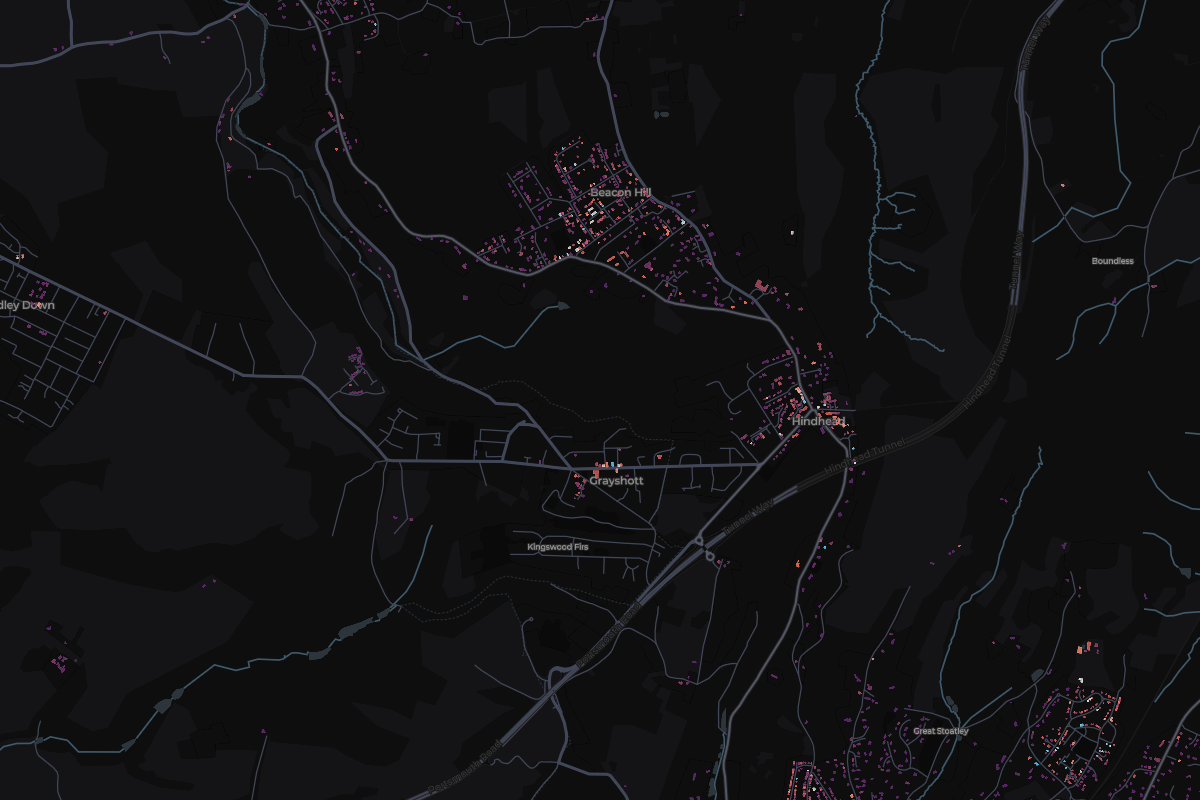
Tap any home in Hindhead to see what it sold for.
Most expensive homes in Hindhead
Sold Oct 2025 – Sept 2026. Tap a home to see it on the map.
- 110 Baskerville DriveDetached · Dec 2025£1,650,000
- 2Tarn Cottage, Tarn RoadDetached · Mar 2026£1,602,500
- 3Bracken House, Whitmore Vale RoadDetached · Jun 2026£1,500,000
- 426 Pine BankDetached · Dec 2025£1,325,000
- 58 HillgarthDetached · Jun 2026£1,295,000
Show 5 moreShow the top 5 only
- 6Holly Lodge, 2 Greening WoodDetached · Jul 2026£1,294,000
- 7Merlewood, Tarn RoadDetached · Dec 2025£1,147,000
- 8Loxwood House, Hazel GroveDetached · Oct 2025£1,135,000
- 9Sunnydene, Linkside EastDetached · Apr 2026£1,100,000
- 10Green Pines, Whitmore Vale RoadDetached · Feb 2026£1,055,000
Most expensive streets in Hindhead
From most to least expensive. Tap a street to see it on the map.
- Tarn Road£1,374,7502 sales
- Whitmore Vale Road£1,277,5002 sales
- Baskerville Drive£1,237,5002 sales
- Forestdale£841,0002 sales
- Highfield Crescent£727,5002 sales
- Tyndalls£582,5002 sales
- Beacon Hill Road£500,0005 sales
- Tilford Road£415,00010 sales
- Hindhead Road£359,5002 sales
- Beacon Crescent£339,0003 sales
Show the other 5 streetsShow the top 10 only
- Beacon Hill Court£247,5002 sales
- Tower Road£241,2506 sales
- Wood Road£202,5004 sales
- The Moorings£197,5002 sales
- Headley Road£155,0002 sales
- Change across the window
- -5.8%
- Sales
- 73
- Share of Waverley
- 4%
8 of 8 places in Waverley, by median
Median sold prices in Hindhead, compared with the wider area
- England
- Surrey
- Waverley
- Hindhead
Property type
Bar length is the share of sales. The price is the median.
- Detached£875,00027 sales
- Semi-detached£539,2508 sales
- Terraced£491,25010 sales
- Flat£235,00024 sales
- OtherNot enough sales4 sales
Price spread
Lower and upper quartile. The mark is the median.
£280,000£825,000
How the sales split
- Freehold66% 48 sales
- Leasehold34% 25 sales
- New build0% 0 sales