Exning house prices
Homes in Exning sold for a median of £386,750, from 44 sales, Oct 2025 – Sept 2026.
The median is £96,750 above Newmarket. Sold prices from HM Land Registry, not valuations.
Exning house prices map
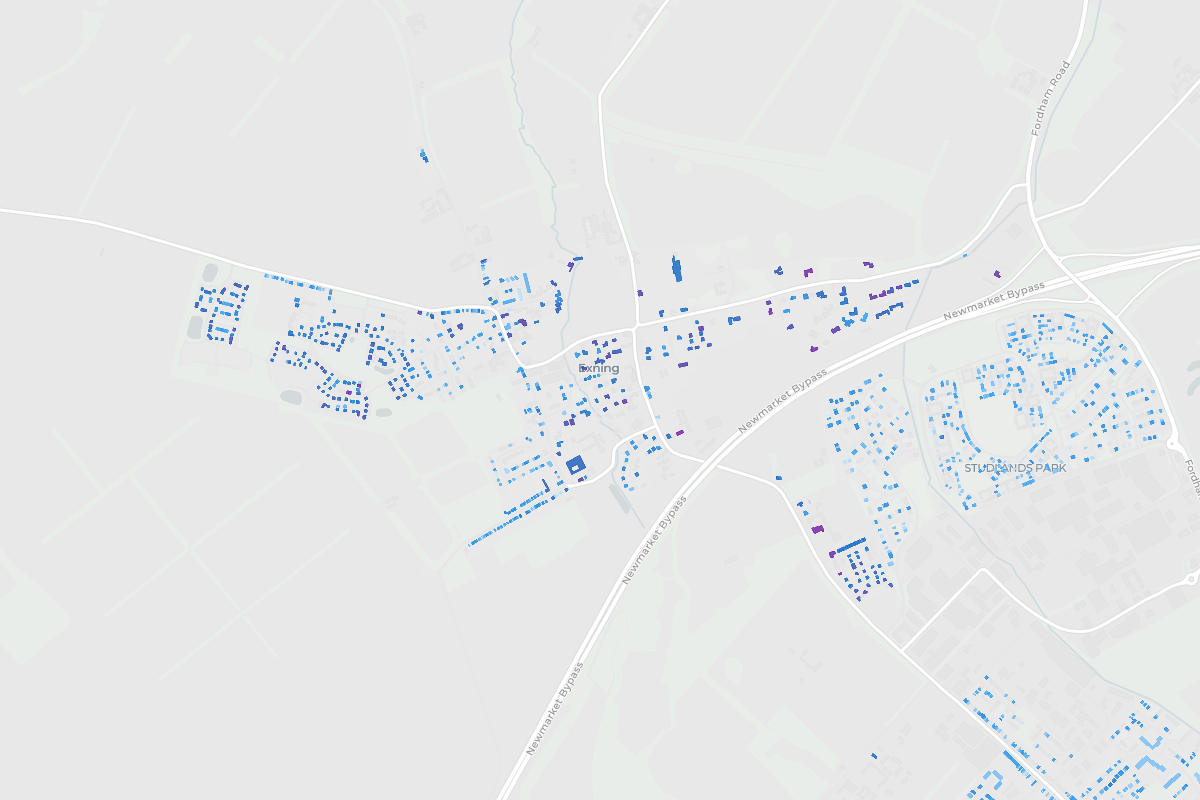
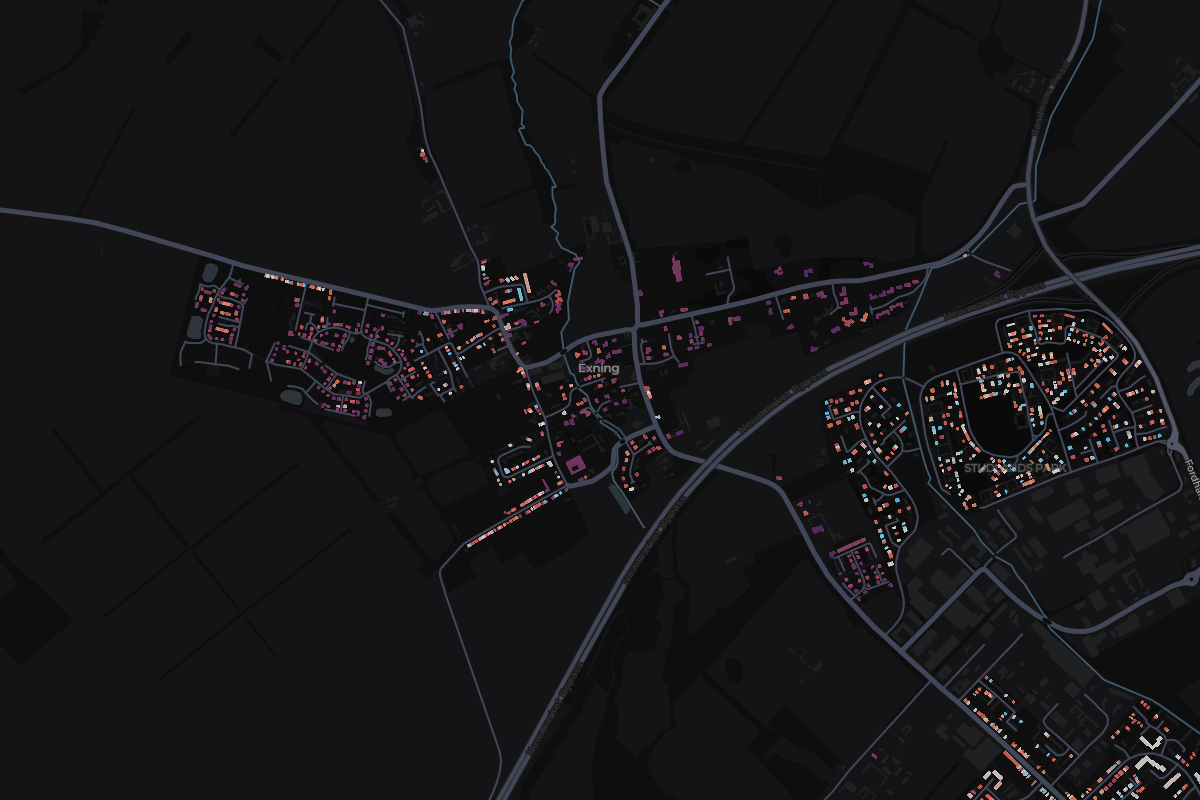
Tap any home in Exning to see what it sold for.
Most expensive homes in Exning
Sold Oct 2025 – Sept 2026. Tap a home to see it on the map.
- 1Glenmore, Windmill HillDetached · Dec 2025£877,500
- 22 Glanely GardensDetached · Dec 2025£775,000
- 3Shires Folly, Beechwood CloseDetached · Oct 2025£735,000
- 4Old Flint Barn, 1 Windmill HillDetached · Nov 2025£730,000
- 59 Honeysuckle WayDetached · New build · Nov 2025£620,000
Show 5 moreShow the top 5 only
Most expensive streets in Exning
From most to least expensive. Tap a street to see it on the map.
- Windmill Hill£730,0003 sales
- Garlic Street£595,0003 sales
- Glebe Drive£570,0003 sales
- Honeysuckle Way£515,0003 sales
- Mallard Way£440,0004 sales
- Primrose Close£435,0006 sales
- Oxford Street£351,5002 sales
- Laceys Lane£252,1504 sales
- Chapel Street£230,0003 sales
- King George Avenue£220,0003 sales
Show the other 1 streetShow the top 10 only
- England
£285,000
676,259 sales
- Suffolk
£278,000
10,556 sales
- West Suffolk
£280,000
2,389 sales
- Newmarket
£290,000
361 sales
Exning
£386,750
44 sales
- Change across the window
- +23.2%
- Sales
- 44
- Share of Newmarket
- 12%
4 of 6 places in Newmarket, by median
Median sold prices in Exning, compared with the wider area
- England
- Suffolk
- West Suffolk
- Newmarket
- Exning
Property type
Bar length is the share of sales. The price is the median.
- Detached£507,50028 sales
- Semi-detachedNot enough sales5 sales
- Terraced£220,00011 sales
Price spread
Lower and upper quartile. The mark is the median.
£270,000£523,750
How the sales split
- Freehold100% 44 sales
- New build39% 17 sales