Shoeburyness house prices
Homes in Shoeburyness sold for a median of £325,000, from 247 sales, Oct 2025 – Sept 2026.
The median is £5,000 below Southend On Sea. Sold prices from HM Land Registry, not valuations.
Shoeburyness house prices map
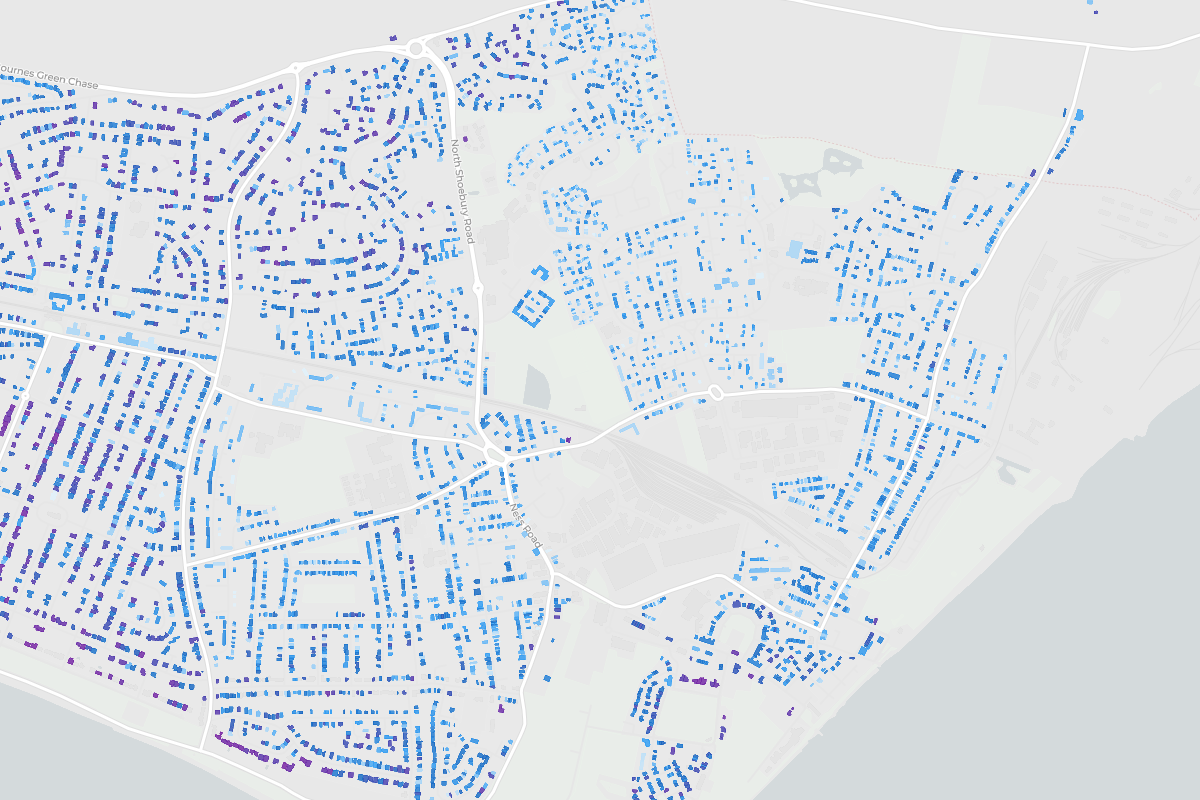
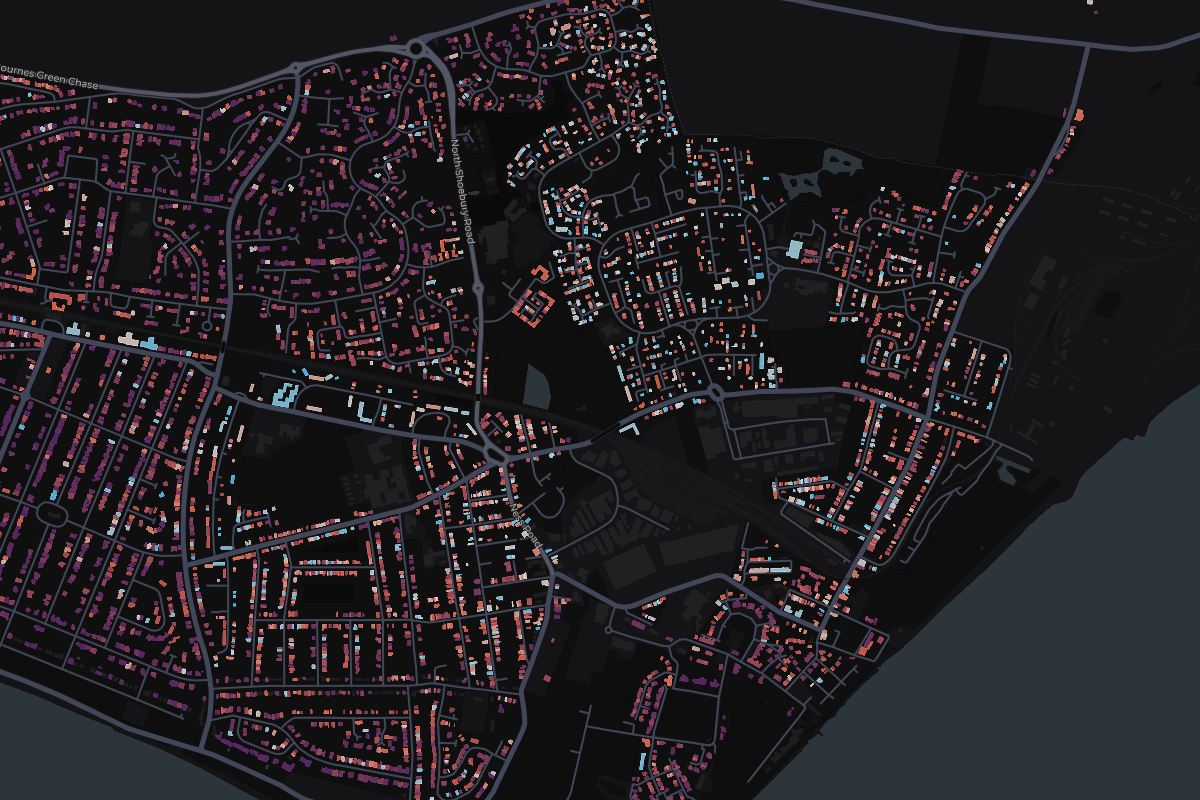
Tap any home in Shoeburyness to see what it sold for.
Most expensive homes in Shoeburyness
Sold Oct 2025 – Sept 2026. Tap a home to see it on the map.
Most expensive streets in Shoeburyness
From most to least expensive. Tap a street to see it on the map.
- Leitrim Avenue£1,767,5002 sales
- Gunners Rise£618,0003 sales
- Horseshoe Crescent£575,0005 sales
- Bishopsteignton£525,00011 sales
- Church Road£475,0005 sales
- Admirals Walk£465,0004 sales
- Thorpedene Gardens£460,0003 sales
- St Andrews Road£450,0004 sales
- Chapel Road£447,5002 sales
- Raphael Drive£440,0005 sales
Show the other 40 streetsShow the top 10 only
- Meacham Way£430,3733 sales
- Aylesbeare£408,7504 sales
- Fremantle£400,0003 sales
- Pentland Avenue£400,0002 sales
- Old School Court£391,2506 sales
- Teigngrace£385,0002 sales
- Yarnacott£376,5002 sales
- Churchfields£360,0003 sales
- Elm Road£360,0003 sales
- Collingwood Way£357,5002 sales
- Caulfield Road£356,2504 sales
- Gunners Road£350,0004 sales
- Shillingstone£350,0004 sales
- Hogarth Drive£347,5002 sales
- Sandpiper Close£331,0004 sales
- Artillery Avenue£327,5002 sales
- Blyth Avenue£325,0003 sales
- Wakering Road£322,5005 sales
- Waterloo Road£316,2502 sales
- Wakering Avenue£315,0003 sales
- Torrington£312,5002 sales
- Ness Road£307,5007 sales
- Goya Rise£292,0004 sales
- Eagle Way£286,5004 sales
- Anson Chase£280,0003 sales
- Caversham Avenue£266,0002 sales
- Tudor Gardens£263,5004 sales
- Ashanti Close£250,0004 sales
- Drewsteignton£241,2502 sales
- The Drakes£240,0009 sales
- Richmond Avenue£240,0008 sales
- High Street£236,5008 sales
- Midsummer Meadow£235,0004 sales
- Blackgate Road£235,0003 sales
- Herongate£222,5002 sales
- Woodcotes£195,0002 sales
- West Road£190,00011 sales
- Smith Street£185,0002 sales
- Thorpe Green£161,0005 sales
- Frobisher Way£159,0005 sales
- England
£285,000
676,259 sales
- Southend On Sea
£330,000
2,490 sales
Shoeburyness
£325,000
247 sales
- Change across the window
- +11.8%
- Sales
- 247
- Share of Southend On Sea
- 10%
4 of 5 places in Southend On Sea, by median
Median sold prices in Shoeburyness, compared with the wider area
- England
- Southend On Sea
- Shoeburyness
Property type
Bar length is the share of sales. The price is the median.
- Detached£522,50039 sales
- Semi-detached£372,50076 sales
- Terraced£295,00083 sales
- Flat£192,00041 sales
- Other£263,7508 sales
Price spread
Lower and upper quartile. The mark is the median.
£251,000£416,500
How the sales split
- Freehold80% 197 sales
- Leasehold20% 50 sales
- New build1% 3 sales