New Ollerton house prices
Homes in New Ollerton sold for a median of £170,000, from 95 sales, Oct 2025 – Sept 2026.
The median is £50,000 below Newark. Sold prices from HM Land Registry, not valuations.
New Ollerton house prices map
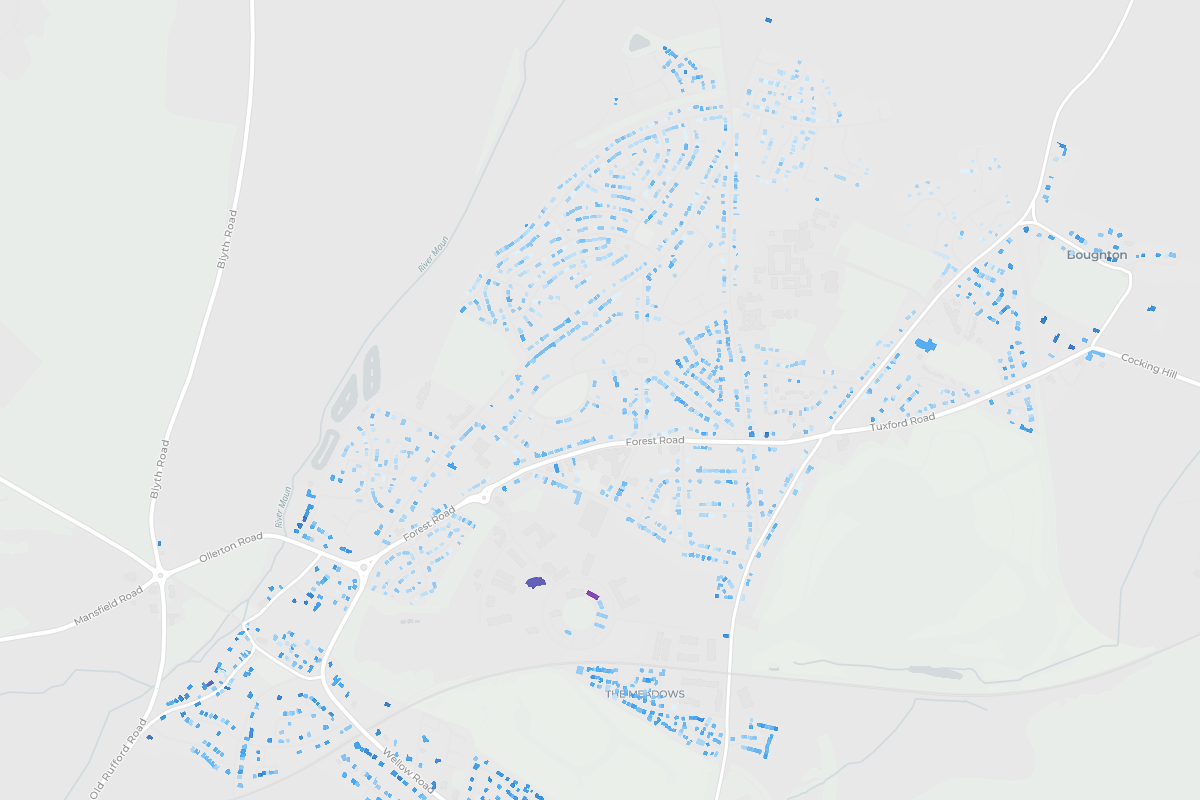
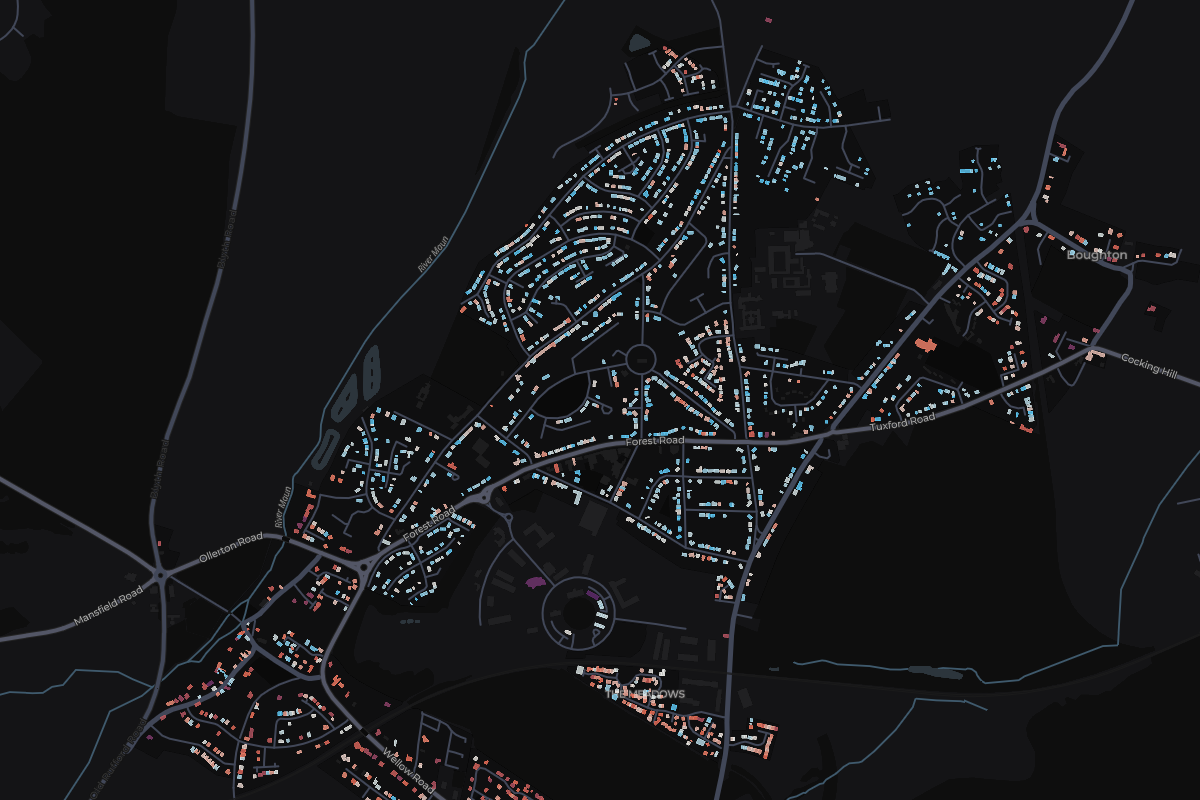
Tap any home in New Ollerton to see what it sold for.
Most expensive homes in New Ollerton
Sold Oct 2025 – Sept 2026. Tap a home to see it on the map.
- 141 Kelsey AvenueDetached · May 2026£300,000
- 21 Canary GroveDetached · May 2026£258,000
- 37 Pastures ViewDetached · New build · Oct 2025£249,995
- 450 Swan LaneDetached · New build · Dec 2025£247,995
- 530 Lantern LaneDetached · New build · Oct 2025£242,995
Show 5 moreShow the top 5 only
- 61 Pastures ViewDetached · New build · Nov 2025£239,995
- 711 Canary GroveDetached · Nov 2025£210,000
- 820 Whitewater RoadSemi-detached · Mar 2026£195,000
- 9Boundary House, Whinney LaneDetached · Dec 2025£192,500
- 10109 Whinney LaneSemi-detached · Apr 2026£190,000
Most expensive streets in New Ollerton
From most to least expensive. Tap a street to see it on the map.
- Forest Road£489,7502 sales
- Canary Grove£210,0003 sales
- Lantern Lane£196,8004 sales
- Swan Lane£190,0007 sales
- Walesby Lane£180,0003 sales
- Whinney Lane£179,9955 sales
- Ford Close£177,6003 sales
- Parkgate Close£176,0002 sales
- Larch Road£175,0002 sales
- Pastures View£173,6007 sales
Show the other 13 streetsShow the top 10 only
- Griffin Road£172,5004 sales
- Poppy Avenue£172,0003 sales
- Whitewater Road£167,5004 sales
- Poplar Street£164,0002 sales
- Briar Court£162,5002 sales
- Headstock Close£162,5002 sales
- Petersmith Drive£140,50012 sales
- The Markhams£140,0003 sales
- Breck Bank£139,0003 sales
- Dove Croft£133,0003 sales
- Birch Road£131,0002 sales
- Cedar Lane£122,7502 sales
- Yew Tree Road£120,0003 sales
- England
£285,000
676,259 sales
- Nottinghamshire
£220,000
14,560 sales
- Newark And Sherwood
£227,000
1,786 sales
- Newark
£220,000
1,238 sales
New Ollerton
£170,000
95 sales
- Change across the window
- -19.3%
- Sales
- 95
- Share of Newark
- 8%
15 of 15 places in Newark, by median
Median sold prices in New Ollerton, compared with the wider area
- England
- Nottinghamshire
- Newark And Sherwood
- Newark
- New Ollerton
Property type
Bar length is the share of sales. The price is the median.
- Detached£200,80017 sales
- Semi-detached£162,00070 sales
- TerracedNot enough sales5 sales
- FlatNot enough sales1 sales
- OtherNot enough sales2 sales
Price spread
Lower and upper quartile. The mark is the median.
£141,000£185,000
How the sales split
- Freehold99% 94 sales
- Leasehold1% 1 sales
- New build21% 20 sales