Lynemouth house prices
Homes in Lynemouth sold for a median of £70,500, from 18 sales, Oct 2025 – Sept 2026.
The median is £179,500 below Morpeth. Sold prices from HM Land Registry, not valuations.
Lynemouth house prices map
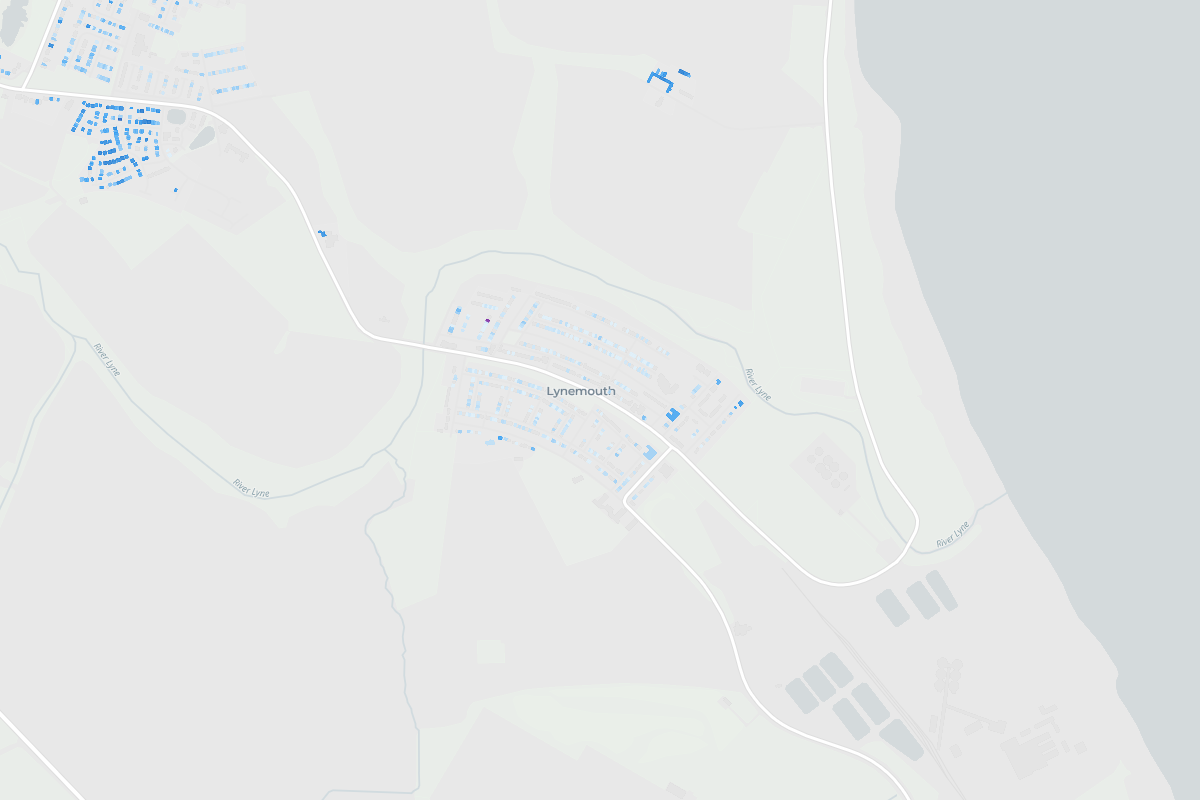
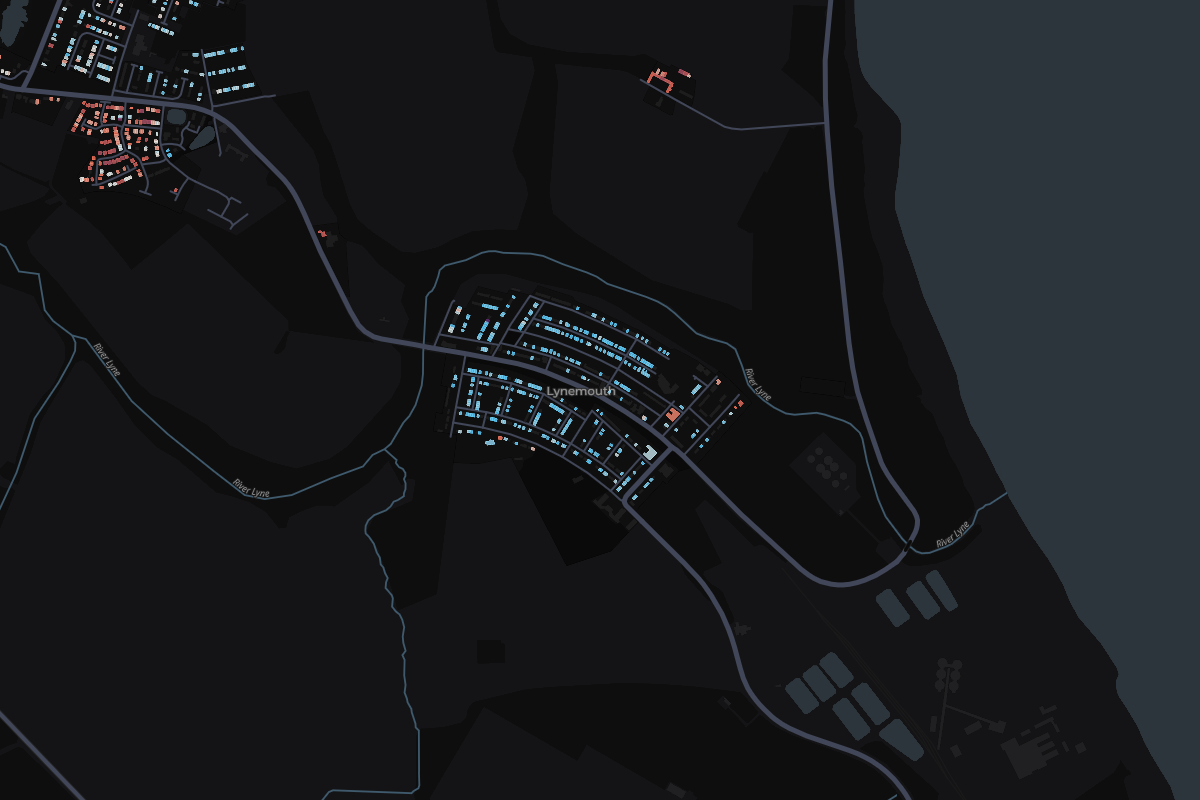
Tap any home in Lynemouth to see what it sold for.
Most expensive homes in Lynemouth
Sold Oct 2025 – Sept 2026. Tap a home to see it on the map.
- 17 Boland RoadTerraced · Dec 2025£130,000
- 28 Boland RoadTerraced · Mar 2026£100,000
- 38 River ViewTerraced · May 2026£95,000
- 422 Fenham RoadTerraced · Jul 2026£87,500
- 57 Dalton AvenueTerraced · Nov 2025£80,000
Most expensive streets in Lynemouth
From most to least expensive. Tap a street to see it on the map.
- England
£285,000
676,259 sales
- Northumberland
£193,000
4,789 sales
- Morpeth
£250,000
969 sales
Lynemouth
£70,500
18 sales
- Price per square metre
- £790
- Sales
- 18
- Share of Morpeth
- 2%
Median of recent sales divided by the energy certificate floor area.
27 of 27 places in Morpeth, by median
Median sold prices in Lynemouth, compared with the wider area
- England
- Northumberland
- Morpeth
- Lynemouth
Property type
Bar length is the share of sales. The price is the median.
- Semi-detachedNot enough sales2 sales
- Terraced£72,50016 sales
How the sales split
- Freehold100% 18 sales
- New build0% 0 sales