Kirkbymoorside house prices
Homes in Kirkbymoorside sold for a median of £240,750, from 60 sales, Oct 2025 – Sept 2026.
The median is £20,250 below North Yorkshire. Sold prices from HM Land Registry, not valuations.
Kirkbymoorside house prices map
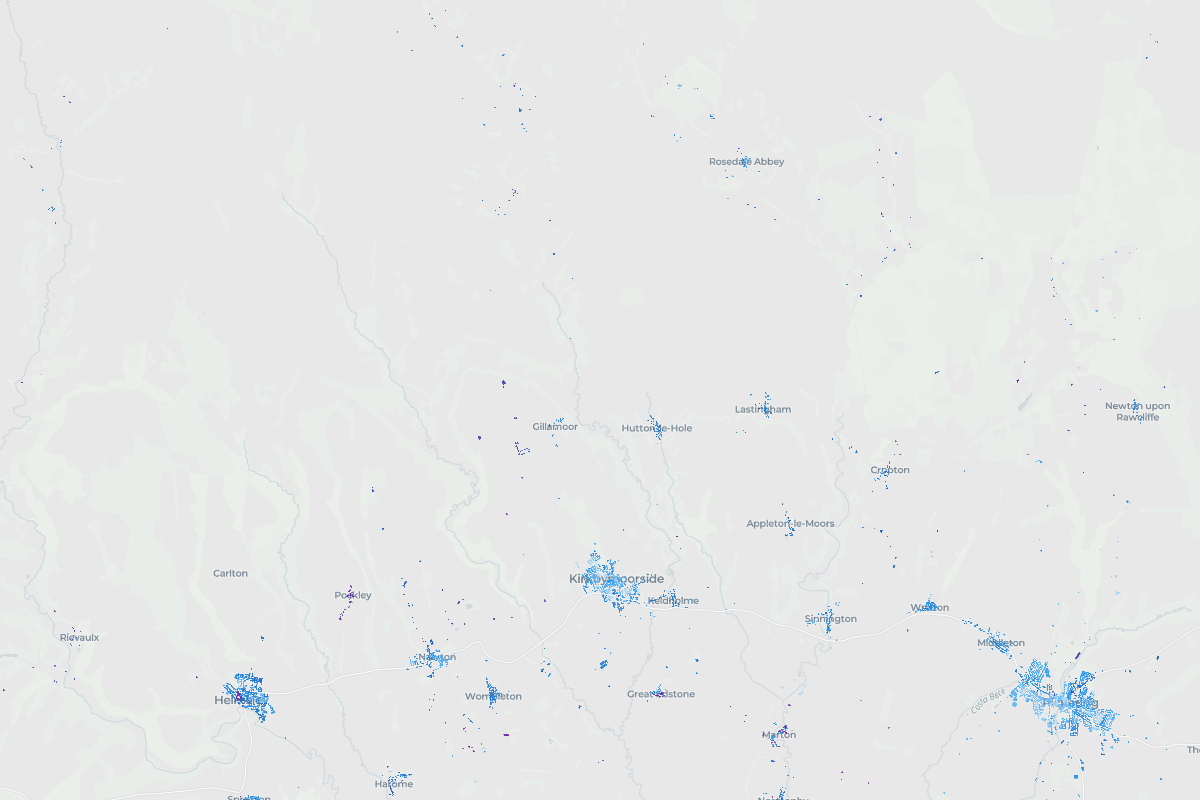
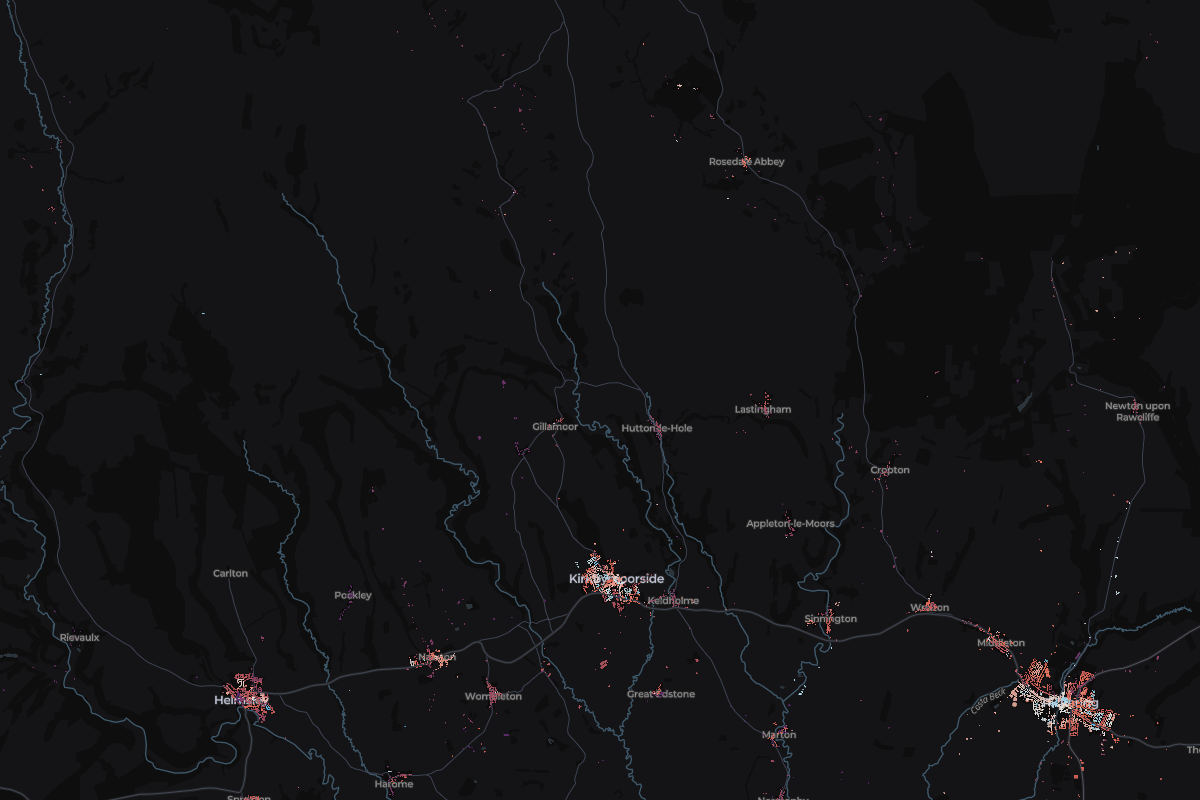
Tap any home in Kirkbymoorside to see what it sold for.
Most expensive homes in Kirkbymoorside
Sold Oct 2025 – Sept 2026. Tap a home to see it on the map.
- 1The Hawthorns, KeldholmeDetached · Apr 2026£500,000
- 251 West EndTerraced · Sept 2026£482,500
- 34 Neville WalkDetached · Oct 2025£440,000
- 414 High Market PlaceDetached · Mar 2026£400,000
- 5Dovecot, Kirkby MillsDetached · Apr 2026£390,000
Show 5 moreShow the top 5 only
Most expensive streets in Kirkbymoorside
From most to least expensive. Tap a street to see it on the map.
- Farndale£550,0002 sales
- Park Lane£340,0002 sales
- Ploughlands Grove£310,0003 sales
- Howkeld Close£282,5002 sales
- Market Place£280,0004 sales
- Poplar Avenue£275,0002 sales
- Castlegate£262,5003 sales
- West End£240,0005 sales
- Keld Head Orchard£225,0005 sales
- Windmill Avenue£202,7502 sales
Show the other 5 streetsShow the top 10 only
- England
£285,000
676,259 sales
- North Yorkshire
£261,000
9,297 sales
Kirkbymoorside
£240,750
60 sales
- Price per square metre
- £2,674
- Sales
- 60
- Share of North Yorkshire
- 0.65%
Median of recent sales divided by the energy certificate floor area.
74 of 91 places in North Yorkshire, by median
Median sold prices in Kirkbymoorside, compared with the wider area
- England
- North Yorkshire
- Kirkbymoorside
Property type
Bar length is the share of sales. The price is the median.
- Detached£325,00023 sales
- Semi-detached£207,80014 sales
- Terraced£231,25016 sales
- FlatNot enough sales3 sales
- OtherNot enough sales4 sales
Price spread
Lower and upper quartile. The mark is the median.
£195,000£323,875
How the sales split
- Freehold92% 55 sales
- Leasehold8% 5 sales
- New build0% 0 sales