Olney house prices
Homes in Olney sold for a median of £400,000, from 156 sales, Oct 2025 – Sept 2026.
The median is £75,000 above Milton Keynes. Sold prices from HM Land Registry, not valuations.
Olney house prices map
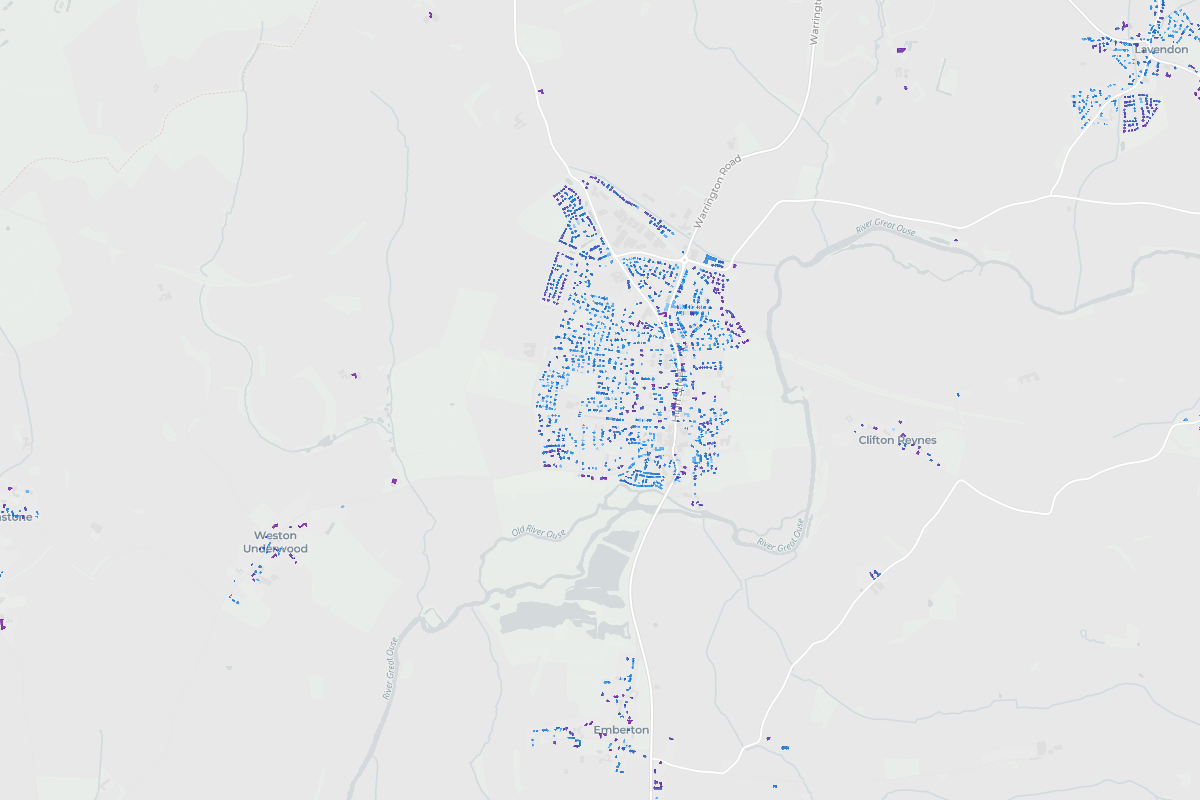
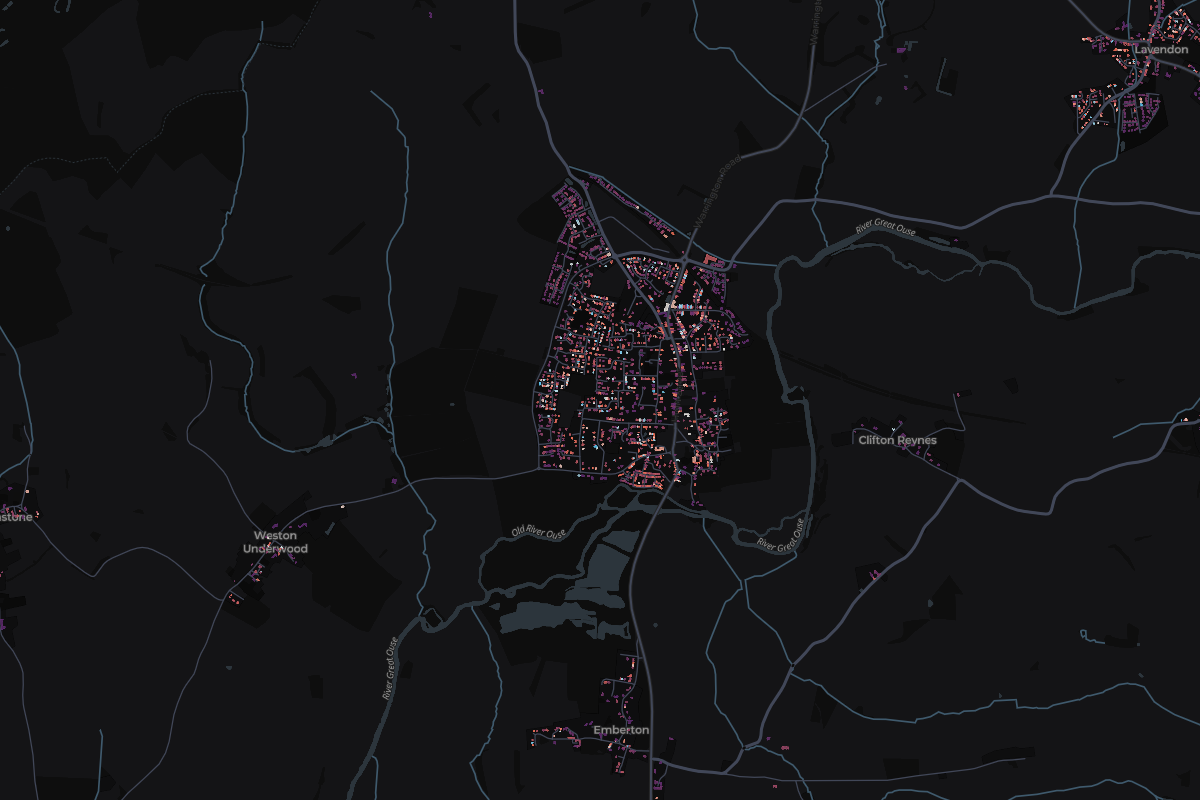
Tap any home in Olney to see what it sold for.
Most expensive homes in Olney
Sold Oct 2025 – Sept 2026. Tap a home to see it on the map.
- 1The Orchard Barn, Stoke Goldington RoadDetached · Ravenstone · Sept 2026£1,185,000
- 278 Midland RoadDetached · Nov 2025£1,100,000
- 329b Spring LaneDetached · May 2026£920,000
- 4The Wheatsheaf, Common StreetDetached · Ravenstone · Feb 2026£865,000
- 53 Stone Pit CloseDetached · Nov 2025£800,000
Show 5 moreShow the top 5 only
- 6107 Limbrey DriveDetached · Dec 2025£800,000
- 79 ConeygereDetached · May 2026£790,000
- 814 DugdaleDetached · Jun 2026£735,000
- 9Turf Moor, 4 White HillDetached · Dec 2025£730,000
- 104 Ferne FurlongDetached · Oct 2025£720,000
Most expensive streets in Olney
Median sold price of streets with 3 or more home sales. Tap a street to see it on the map.
- England
£285,000
676,259 sales
- Milton Keynes
£325,000
3,395 sales
Olney
£400,000
156 sales
- Change across the window
- -9.9%
- Sales
- 156
- Share of Milton Keynes
- 5%
19 of 78 places in Milton Keynes, by median
Median sold prices in Olney, compared with the wider area
- England
- Milton Keynes
- Olney
Property type
Bar length is the share of sales. The price is the median.
- Detached£525,00060 sales
- Semi-detached£370,00043 sales
- Terraced£329,00034 sales
- Flat£180,00013 sales
- OtherNot enough sales6 sales
Price spread
Lower and upper quartile. The mark is the median.
£318,500£525,000
How the sales split
- Freehold91% 142 sales
- Leasehold9% 14 sales
- New build1% 2 sales