St Marys Island house prices
Homes in St Marys Island sold for a median of £352,500, from 44 sales, Oct 2025 – Sept 2026.
The median is £72,500 above Chatham. Sold prices from HM Land Registry, not valuations.
St Marys Island house prices map
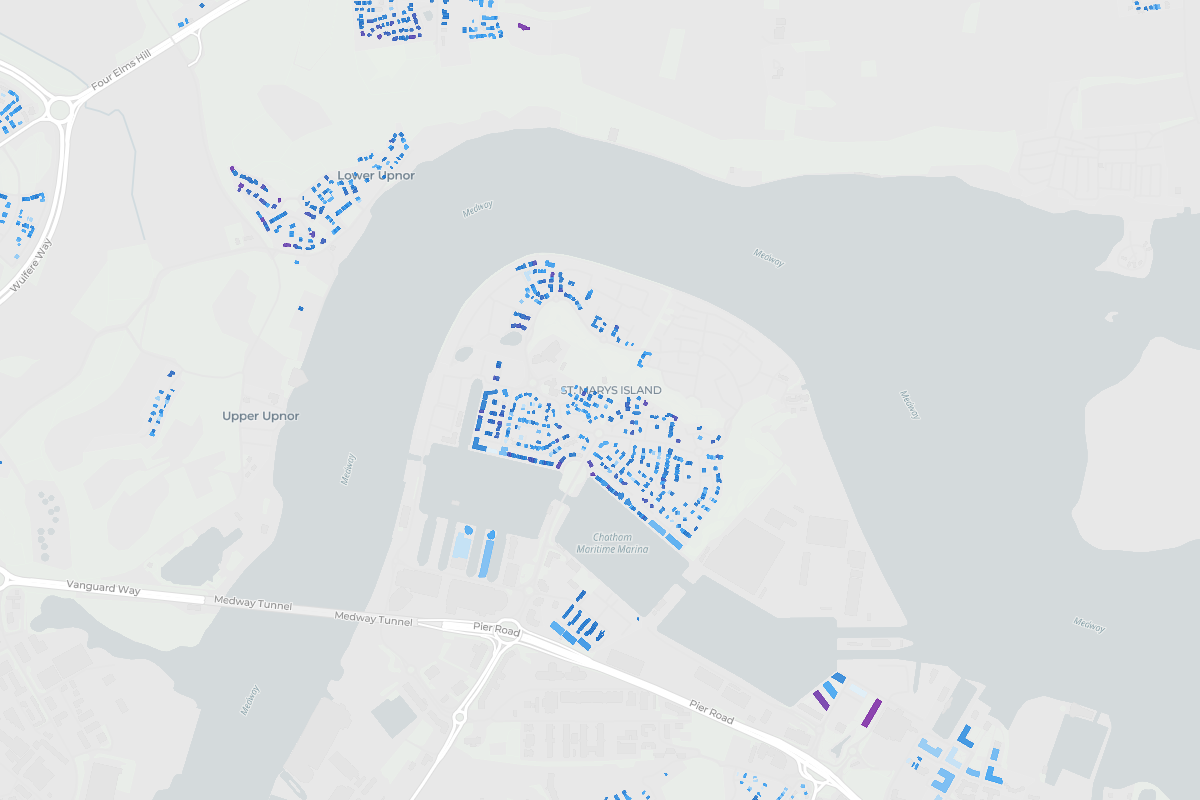
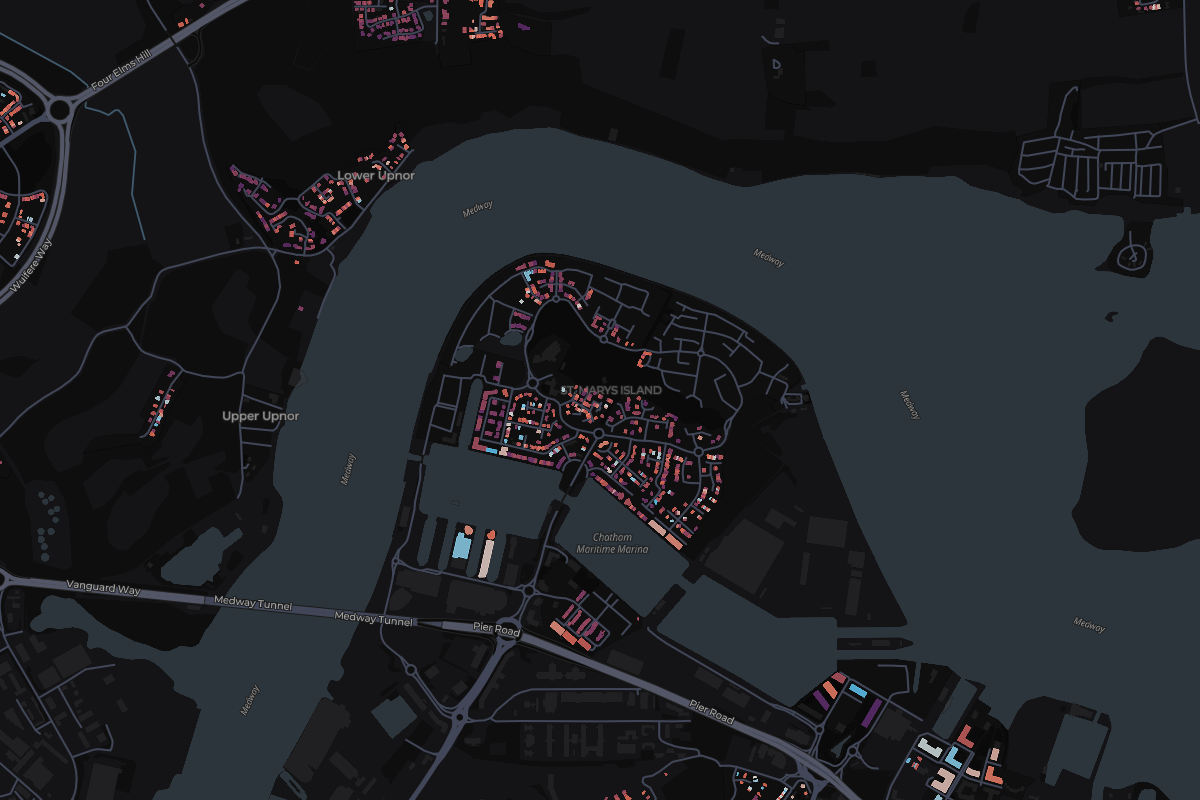
Tap any home in St Marys Island to see what it sold for.
Most expensive homes in St Marys Island
Sold Oct 2025 – Sept 2026. Tap a home to see it on the map.
- 1163 EdgewaterTerraced · Jul 2026£885,000
- 248 Westerly WaySemi-detached · Jan 2026£800,000
- 310 Westerly WaySemi-detached · Apr 2026£760,000
- 438 RipplewatersDetached · Jun 2026£648,000
- 510 Samphire WayTerraced · Nov 2025£612,000
Show 5 moreShow the top 5 only
- 613 Ringlet RoadDetached · Jun 2026£565,000
- 75 The CrescentDetached · Feb 2026£495,000
- 85 Westerly WayDetached · Nov 2025£490,000
- 95 Main StreetDetached · Jan 2026£482,500
- 104 Redshank RoadSemi-detached · Feb 2026£475,000
Most expensive streets in St Marys Island
From most to least expensive. Tap a street to see it on the map.
- Westerly Way£760,0003 sales
- Edgewater£617,5002 sales
- Ringlet Road£517,5002 sales
- Samphire Way£478,5002 sales
- Ripplewaters£355,0004 sales
- Little Victory Mount£344,2502 sales
- Redshank Road£318,5002 sales
- Stonecrop Close£316,0002 sales
- Goldcrest Drive£312,5002 sales
- Pochard Close£305,0002 sales
Show the other 2 streetsShow the top 10 only
- Phalarope Way£286,2502 sales
- Watersmeet£166,0002 sales
- Price per square metre
- £4,188
- Sales
- 44
- Share of Chatham
- 5%
Median of recent sales divided by the energy certificate floor area.
Median sold prices in St Marys Island, compared with the wider area
- England
- Medway
- Chatham
- St Marys Island
Property type
Bar length is the share of sales. The price is the median.
- Detached£470,00011 sales
- Semi-detachedNot enough sales6 sales
- Terraced£345,00013 sales
- Flat£276,25014 sales
Price spread
Lower and upper quartile. The mark is the median.
£309,250£464,375
How the sales split
- Freehold66% 29 sales
- Leasehold34% 15 sales
- New build2% 1 sales