Gayton Le Marsh house prices
Gayton Le Marsh had 1 sale, Oct 2025 – Sept 2026. That is too few for a median price.
Sold prices from HM Land Registry, not valuations.
Gayton Le Marsh house prices map
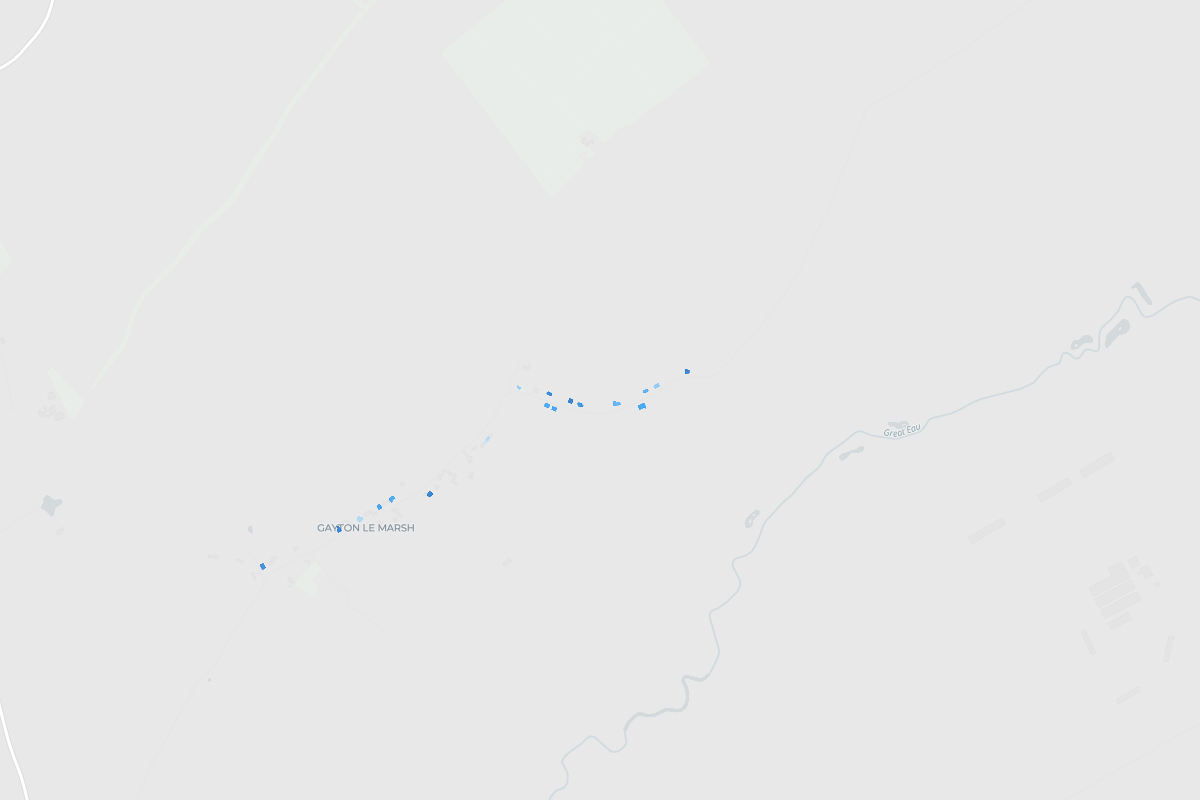
Tap any home in Gayton Le Marsh to see what it sold for.
- England
£285,000
676,259 sales
- Lincolnshire
£220,000
10,867 sales
- East Lindsey
£204,974
2,002 sales
- Alford
£200,000
94 sales
Gayton Le Marsh
Not enough sales
1 sales
- Change across the window
- Not enough sales
- Sales
- 1
- Share of Alford
- 1%
Median sold prices in Gayton Le Marsh, compared with the wider area
- England
- Lincolnshire
- East Lindsey
- Alford
- Gayton Le Marsh
Property type
Bar length is the share of sales. The price is the median.
- DetachedNot enough sales1 sales
How the sales split
- Freehold100% 1 sales
- New build0% 0 sales
Every home sold in Gayton Le Marsh
From most to least expensive. Tap a home to see it on the map.