Belmont house prices
Homes in Belmont sold for a median of £225,000, from 57 sales, Oct 2025 – Sept 2026.
The median is £65,000 below Herefordshire. Sold prices from HM Land Registry, not valuations.
Belmont house prices map
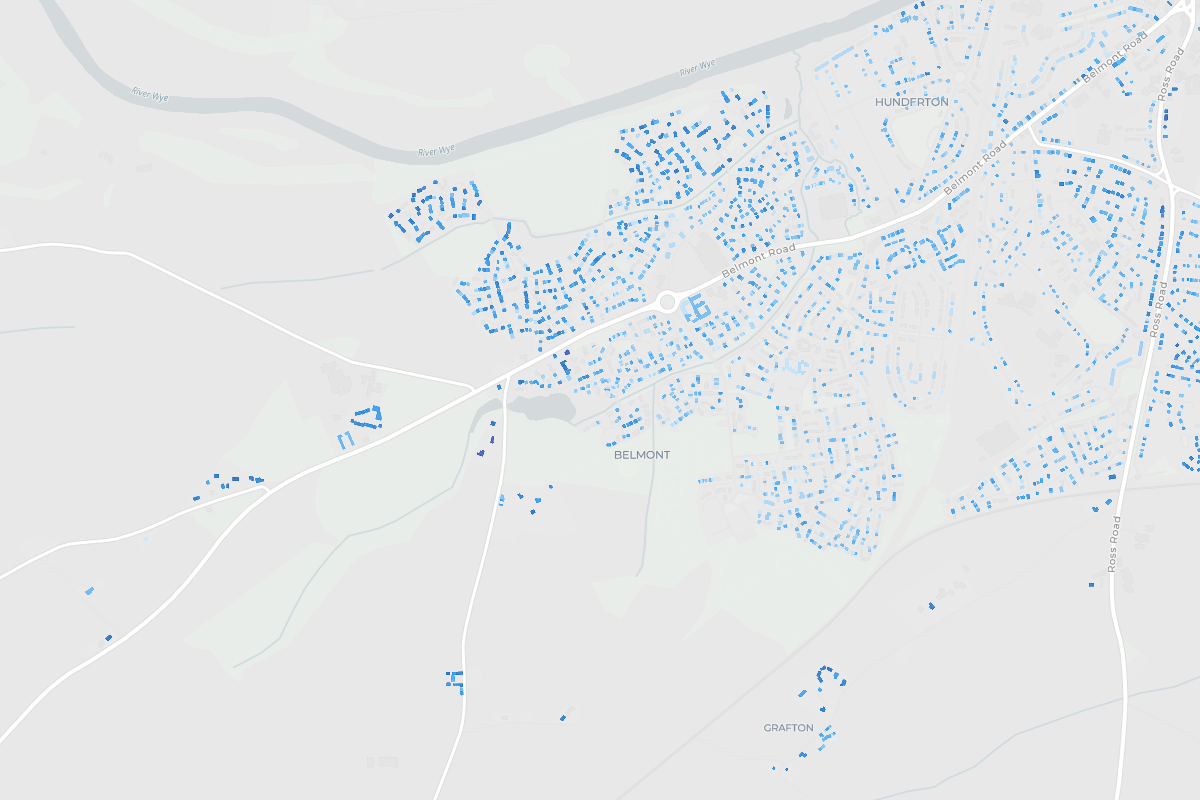
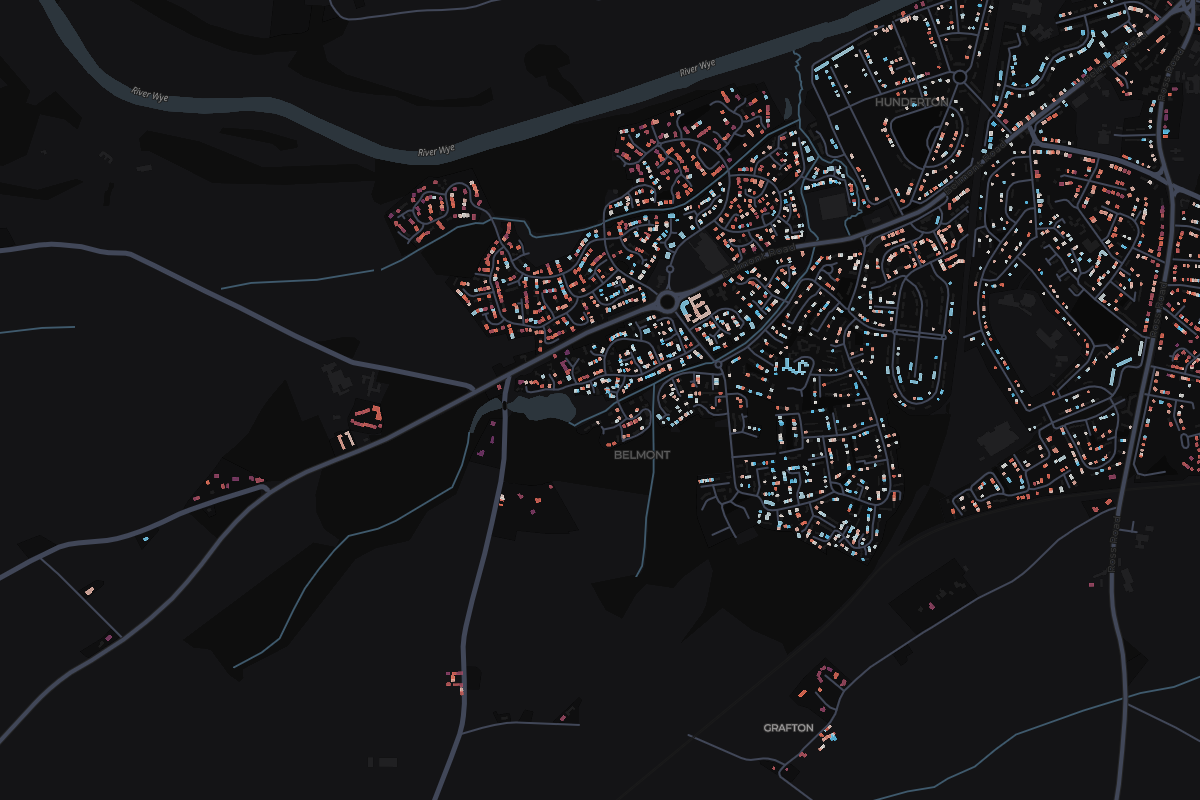
Tap any home in Belmont to see what it sold for.
Most expensive homes in Belmont
Sold Oct 2025 – Sept 2026. Tap a home to see it on the map.
Most expensive streets in Belmont
From most to least expensive. Tap a street to see it on the map.
- Dorchester Way£307,5006 sales
- Woodfield Gardens£260,0002 sales
- Grantham Close£258,0003 sales
- Abingdon Drive£255,5002 sales
- Wenlock Close£242,5002 sales
- Westholme Road£215,0005 sales
- Field Farm Mews£195,0002 sales
- Eastholme Avenue£191,2502 sales
- Monkscroft Drive£190,0002 sales
- Coppin Rise£187,5002 sales
Show the other 3 streetsShow the top 10 only
- Blackthorn Close£183,7502 sales
- Wheatridge Road£165,0003 sales
- Brook Farm Court£75,0003 sales
- England
£285,000
676,259 sales
- Herefordshire
£290,000
2,371 sales
Belmont
£225,000
57 sales
- Price per square metre
- £2,848
- Sales
- 57
- Share of Herefordshire
- 2%
Median of recent sales divided by the energy certificate floor area.
33 of 35 places in Herefordshire, by median
Median sold prices in Belmont, compared with the wider area
- England
- Herefordshire
- Belmont
Property type
Bar length is the share of sales. The price is the median.
- Detached£329,50014 sales
- Semi-detached£239,00014 sales
- Terraced£185,00021 sales
- Flat£95,7508 sales
Price spread
Lower and upper quartile. The mark is the median.
£175,000£280,000
How the sales split
- Freehold84% 48 sales
- Leasehold16% 9 sales
- New build0% 0 sales