Pennington house prices
Homes in Pennington sold for a median of £385,000, from 54 sales, Oct 2025 – Sept 2026.
The median is £114,999 below Lymington. Sold prices from HM Land Registry, not valuations.
Pennington house prices map
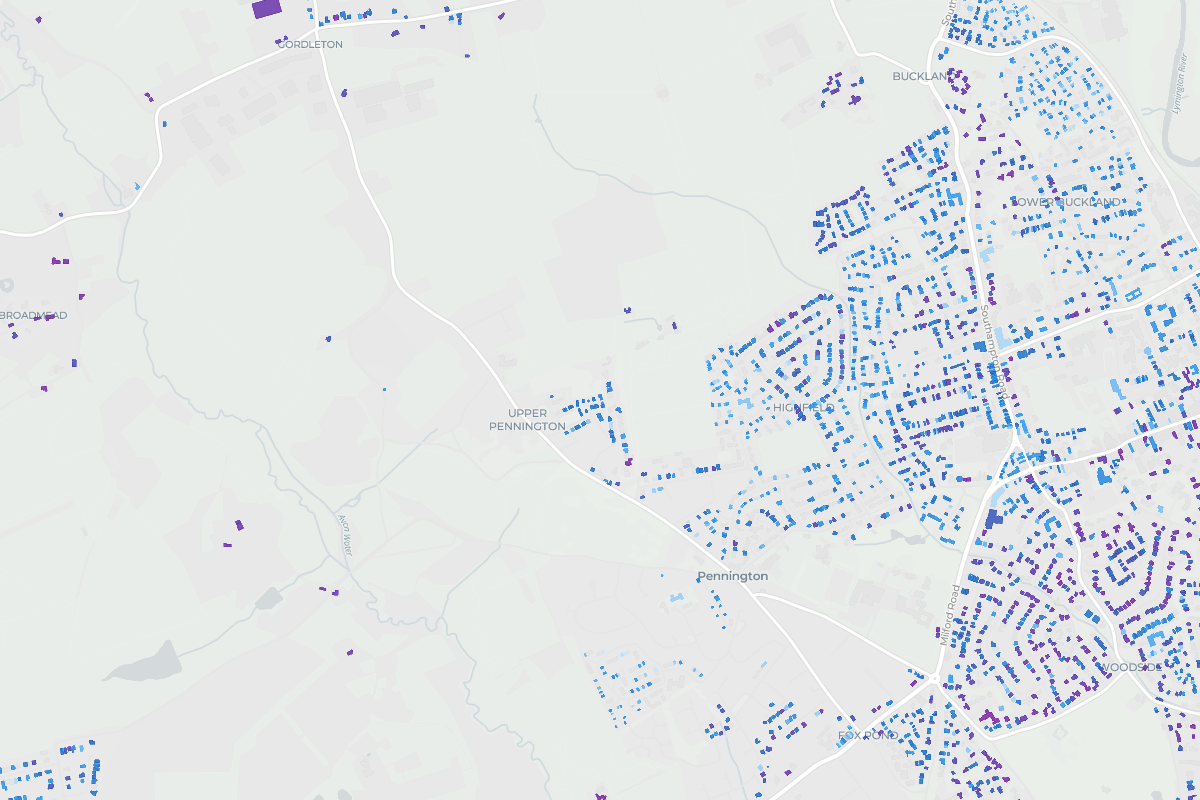
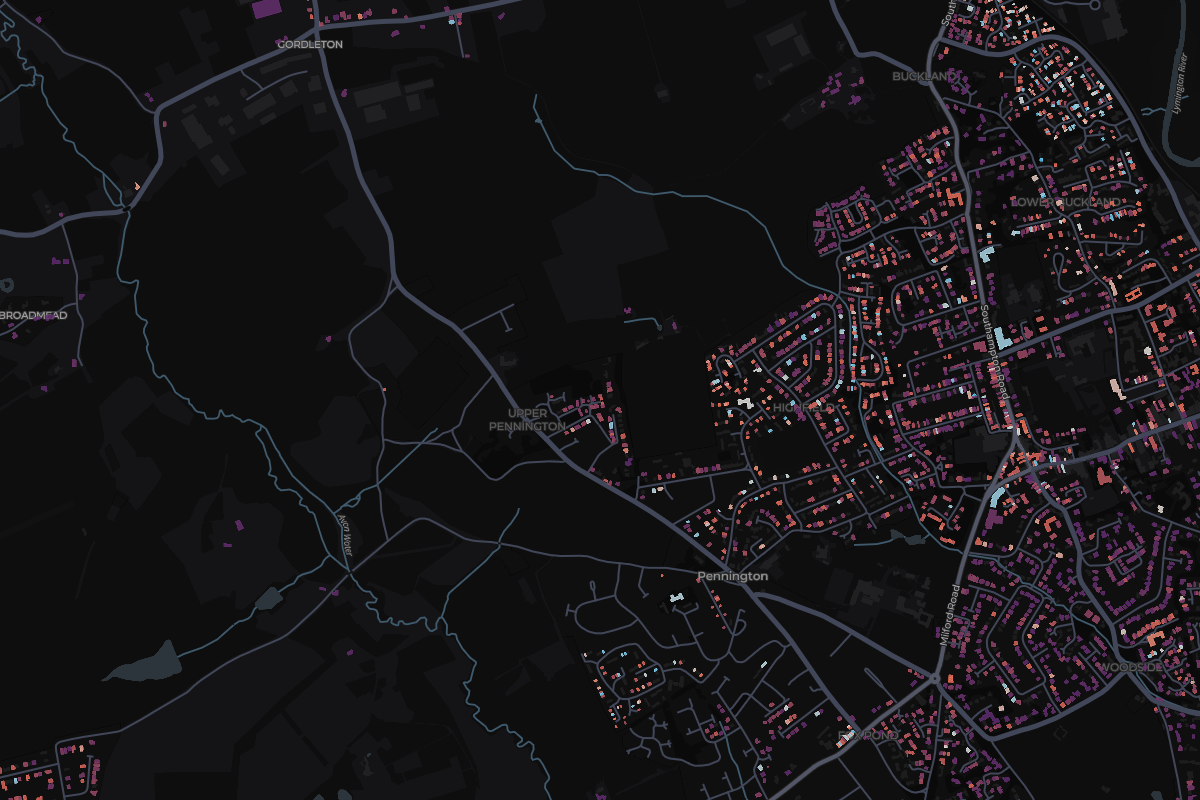
Tap any home in Pennington to see what it sold for.
Most expensive homes in Pennington
Sold Oct 2025 – Sept 2026. Tap a home to see it on the map.
- 1Querencia, Wainsford RoadDetached · Feb 2026£1,085,000
- 273 Ramley RoadDetached · Oct 2025£875,000
- 310 Oliver RoadDetached · Jul 2026£800,000
- 44 Haglane CopseDetached · Aug 2026£790,000
- 546 Haglane CopseDetached · Jun 2026£750,000
Show 5 moreShow the top 5 only
Most expensive streets in Pennington
From most to least expensive. Tap a street to see it on the map.
- Haglane Copse£645,0006 sales
- Wainsford Road£605,0003 sales
- Ramley Road£603,2502 sales
- Lodge Road£515,0002 sales
- Pitmore Lane£425,0004 sales
- Pennington Oval£353,5004 sales
- Grafton Gardens£325,0003 sales
- Pound Road£319,7502 sales
- Bays Road£307,4752 sales
- Little Dene Copse£280,0003 sales
Show the other 1 streetShow the top 10 only
- Milford Road£108,5742 sales
- England
£285,000
676,259 sales
- Hampshire
£362,500
18,441 sales
- New Forest
£381,000
2,409 sales
- Lymington
£499,999
501 sales
Pennington
£385,000
54 sales
- Change across the window
- -9.9%
- Sales
- 54
- Share of Lymington
- 11%
6 of 6 places in Lymington, by median
Median sold prices in Pennington, compared with the wider area
- England
- Hampshire
- New Forest
- Lymington
- Pennington
Property type
Bar length is the share of sales. The price is the median.
- Detached£610,00021 sales
- Semi-detached£333,00019 sales
- Terraced£307,5008 sales
- FlatNot enough sales3 sales
- OtherNot enough sales3 sales
Price spread
Lower and upper quartile. The mark is the median.
£300,500£595,238
How the sales split
- Freehold94% 51 sales
- Leasehold6% 3 sales
- New build0% 0 sales