Hollingworth house prices
Homes in Hollingworth sold for a median of £197,000, from 39 sales, Oct 2025 – Sept 2026.
The median is £18,000 below Hyde. Sold prices from HM Land Registry, not valuations.
Hollingworth house prices map
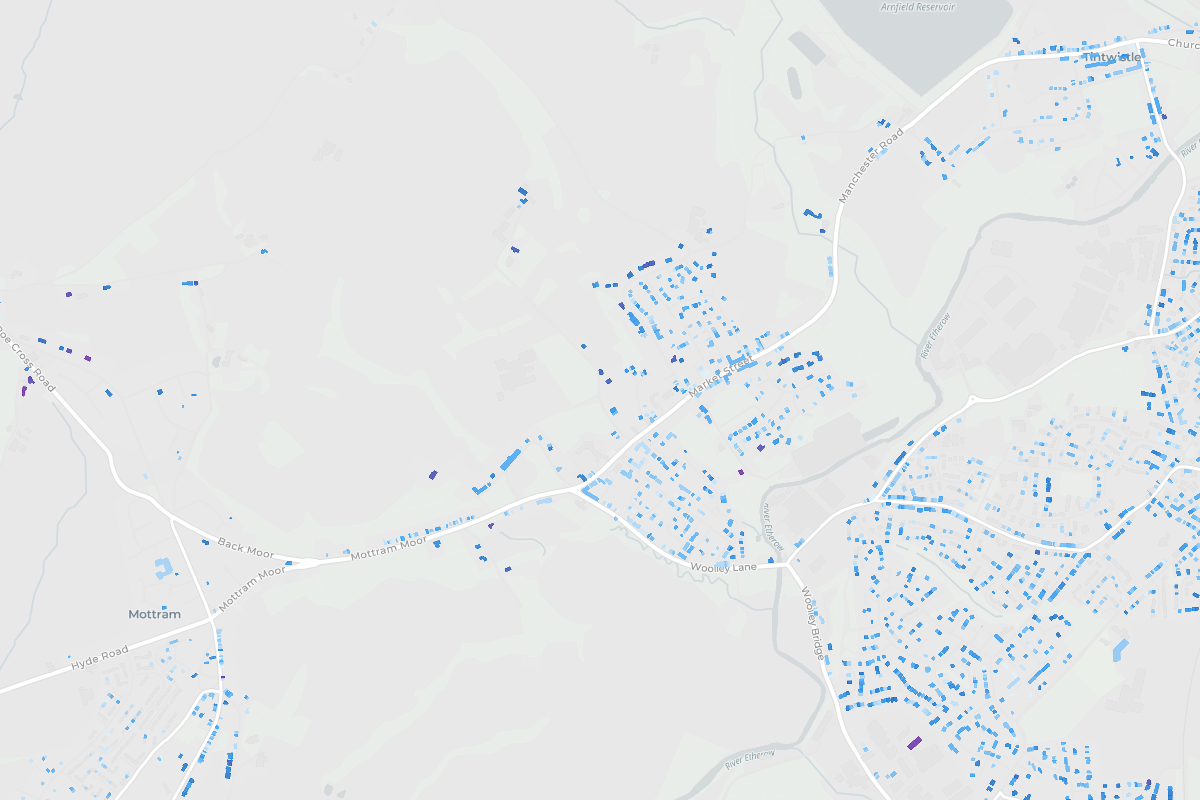
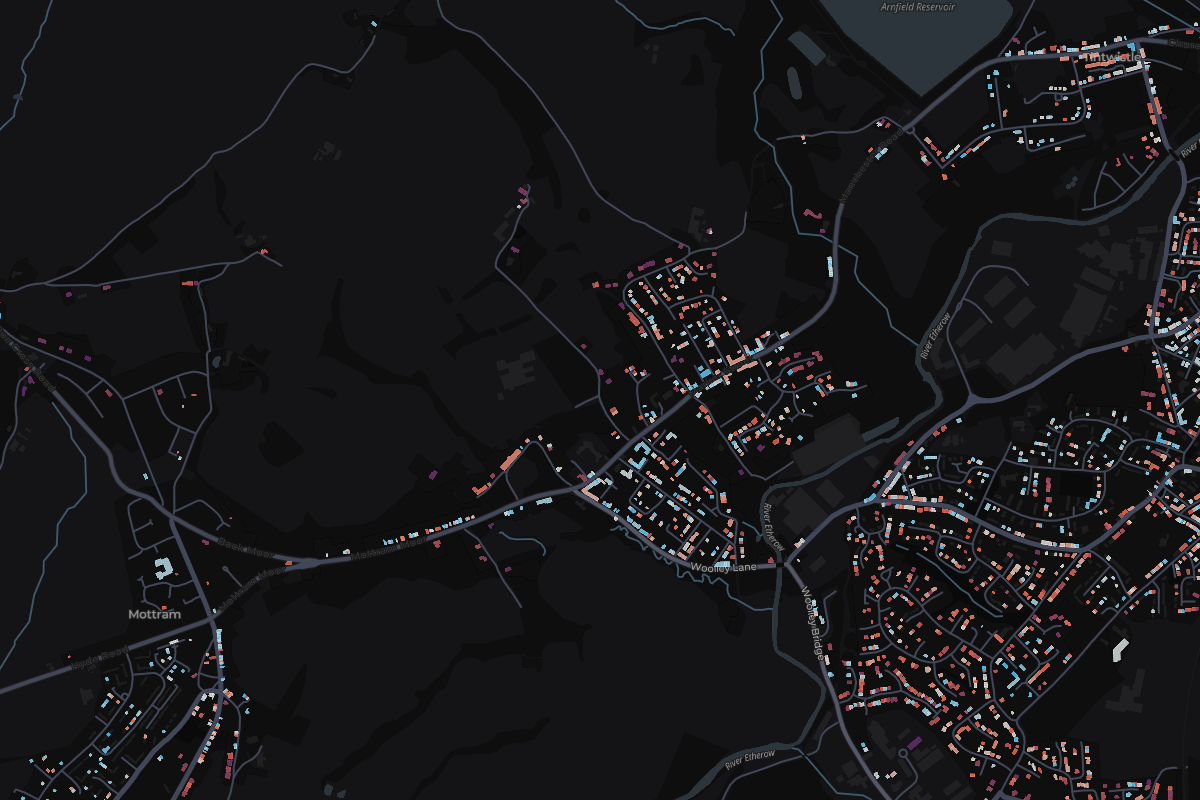
Tap any home in Hollingworth to see what it sold for.
Most expensive homes in Hollingworth
Sold Oct 2025 – Sept 2026. Tap a home to see it on the map.
- 166 Green LaneDetached · Feb 2026£600,000
- 29 Thorncliffe ValeDetached · Mar 2026£470,000
- 326 Highfield GardensDetached · Sept 2026£280,000
- 437 Holly BankSemi-detached · Jan 2026£249,950
- 538 Holly BankSemi-detached · Dec 2025£231,000
Show 5 moreShow the top 5 only
- 67 Water LaneTerraced · Oct 2025£230,000
- 78 Holly BankSemi-detached · Dec 2025£228,000
- 83 Fields GroveSemi-detached · Dec 2025£228,000
- 950 Taylor StreetTerraced · Mar 2026£227,000
- 104 Millbrook CottagesTerraced · Dec 2025£215,000
Most expensive streets in Hollingworth
From most to least expensive. Tap a street to see it on the map.
- England
£285,000
676,259 sales
- Greater Manchester
£230,000
33,271 sales
- Tameside
£210,000
2,677 sales
- Hyde
£215,000
655 sales
Hollingworth
£197,000
39 sales
- Price per square metre
- £2,561
- Sales
- 39
- Share of Hyde
- 6%
Median of recent sales divided by the energy certificate floor area.
3 of 3 places in Hyde, by median
Median sold prices in Hollingworth, compared with the wider area
- England
- Greater Manchester
- Tameside
- Hyde
- Hollingworth
Property type
Bar length is the share of sales. The price is the median.
- DetachedNot enough sales4 sales
- Semi-detachedNot enough sales7 sales
- Terraced£190,00021 sales
- FlatNot enough sales4 sales
- OtherNot enough sales3 sales
Price spread
Lower and upper quartile. The mark is the median.
£179,500£228,000
How the sales split
- Freehold46% 18 sales
- Leasehold54% 21 sales
- New build0% 0 sales