Royton house prices
Homes in Royton sold for a median of £227,000, from 297 sales, Oct 2025 – Sept 2026.
The median is £25,000 above Oldham. Sold prices from HM Land Registry, not valuations.
Royton house prices map
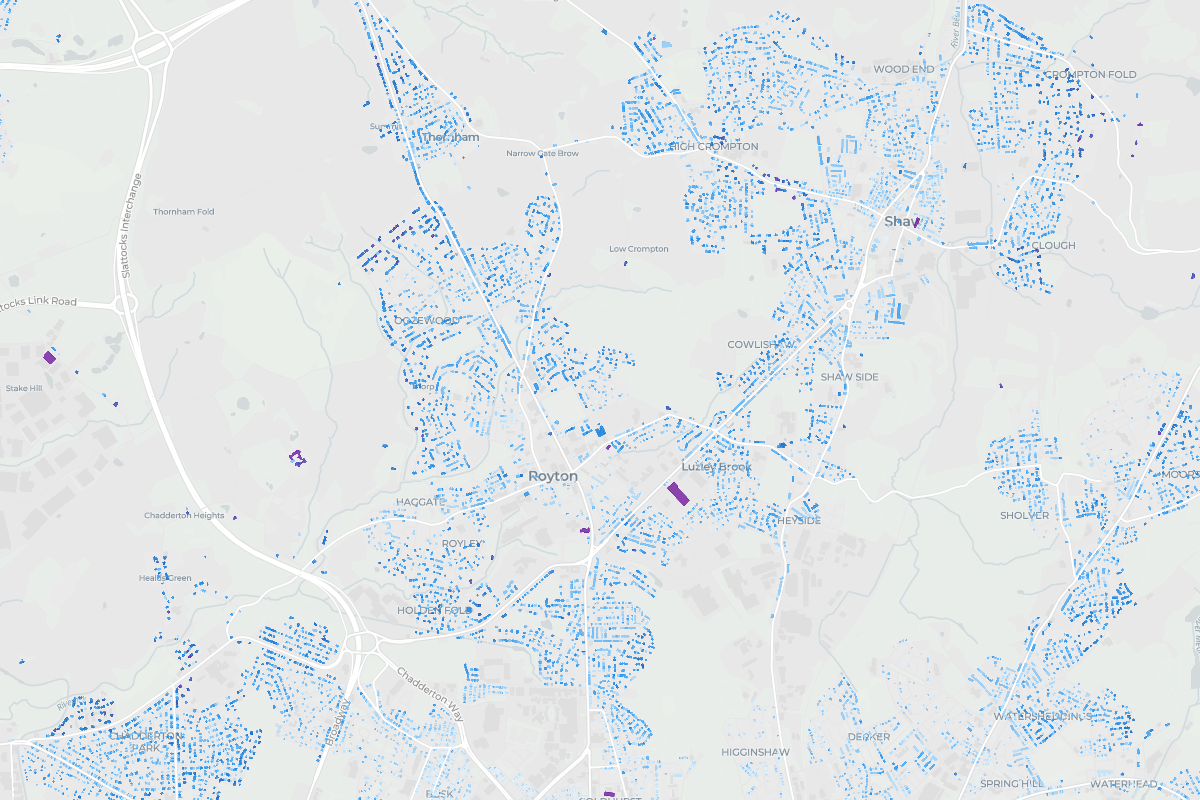
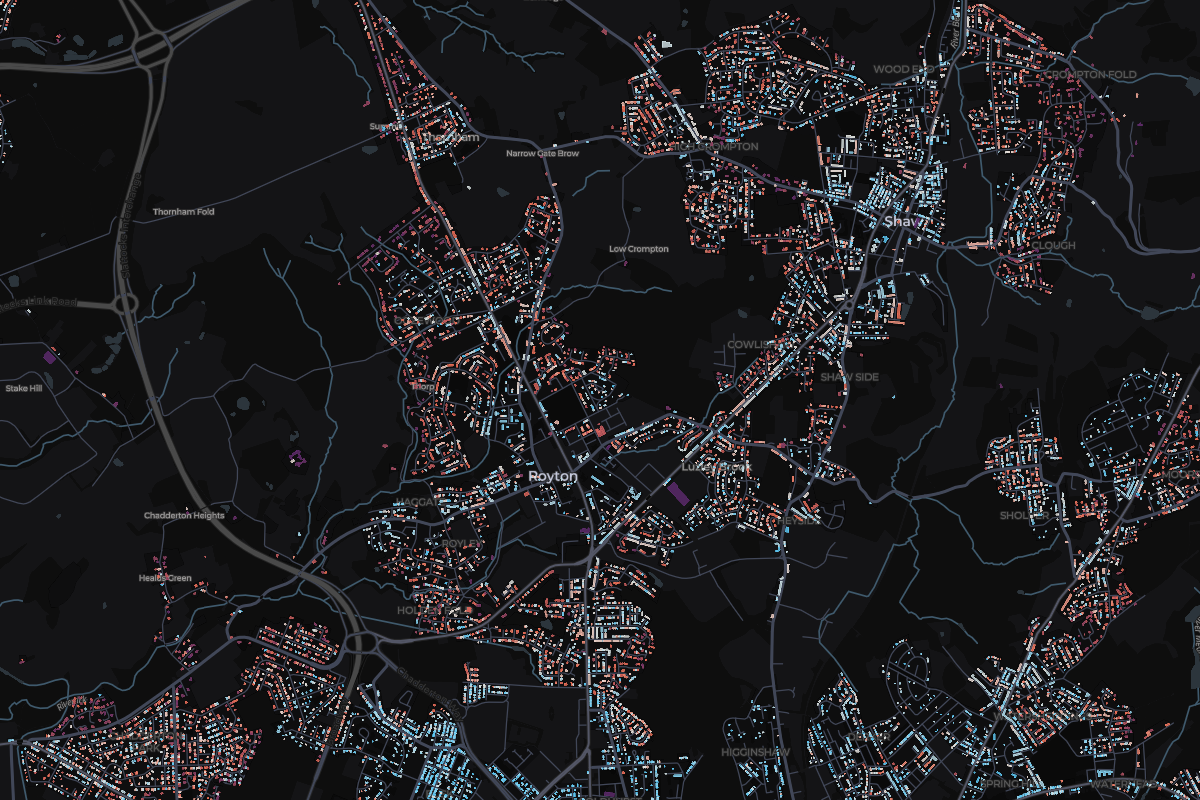
Tap any home in Royton to see what it sold for.
Most expensive homes in Royton
Sold Oct 2025 – Sept 2026. Tap a home to see it on the map.
- 110 Bennett WayDetached · New build · Nov 2025£605,000
- 221 Kirkdale DriveDetached · Nov 2025£550,000
- 3Brima House, ThorpDetached · Mar 2026£530,000
- 4Brima House, ThorpDetached · Mar 2026£530,000
- 511 Thornham Old RoadSemi-detached · Feb 2026£525,000
Most expensive streets in Royton
From most to least expensive. Tap a street to see it on the map.
- Thorp£530,0002 sales
- Bennett Way£450,0003 sales
- Kirkdale Drive£417,5002 sales
- Highfield Drive£385,0002 sales
- Tandlewood Park£380,0002 sales
- Ashwood Drive£371,0002 sales
- Grasmere Road£370,0003 sales
- Higham Close£349,0752 sales
- Holme Crescent£330,0002 sales
- Lindale Avenue£330,0002 sales
Show the other 60 streetsShow the top 10 only
- Millside Way£320,0002 sales
- Delta Close£307,5002 sales
- Elmstone Drive£295,0004 sales
- Otmoor Way£295,0003 sales
- Milton Street£280,0005 sales
- Highlands£280,0002 sales
- Broadway£278,0005 sales
- Beechwood Drive£272,5002 sales
- Thornham Lane£271,2502 sales
- Penthorpe Drive£269,6002 sales
- Windmill Close£267,5002 sales
- Cleveland Grove£263,7502 sales
- Crocus Drive£262,5002 sales
- Denbydale Way£262,0004 sales
- Rosebay Close£245,0004 sales
- Dorchester Drive£245,0002 sales
- Camberwell Way£240,0003 sales
- Malvern Close£239,9503 sales
- Valley New Road£238,0003 sales
- Carlton Way£237,5002 sales
- Shepherd Street£237,5002 sales
- Cornish Way£236,2256 sales
- Holden Fold Lane£236,0007 sales
- Mendip Close£236,0002 sales
- Clifton Crescent£235,5004 sales
- Bodmin Close£232,0002 sales
- Helston Drive£231,5004 sales
- Lea View£225,0003 sales
- Bullcote Green£222,5002 sales
- Westminster Avenue£217,5002 sales
- Harewood Drive£215,0003 sales
- Blackshaw Lane£211,4754 sales
- Alpine Drive£210,0004 sales
- Penryn Avenue£210,0003 sales
- Middleton Road£208,5003 sales
- Springfield Lane£207,7502 sales
- Fir Bank Road£205,9752 sales
- Dogford Road£201,2502 sales
- Kensington Avenue£201,0002 sales
- Holly Bank£197,5002 sales
- Lily Street£194,9993 sales
- Fir Lane£192,4752 sales
- Verney Road£187,4752 sales
- Chapel Lane£176,0003 sales
- Seville Street£172,5502 sales
- Chapel Croft£171,6002 sales
- Rochdale Road£170,00013 sales
- Clarence Street£170,0002 sales
- Oldham Road£166,5006 sales
- Millwood Court£164,9752 sales
- Mellalieu Street£160,2252 sales
- Bromley Avenue£157,5002 sales
- Turf Lane£156,0005 sales
- Baldwins Close£149,0002 sales
- Norwood Crescent£145,0002 sales
- Shaw Road£142,50010 sales
- Hebron Street£142,0005 sales
- Lowe Green£135,0002 sales
- The Fairways£118,6752 sales
- St Phillips Drive£94,1504 sales
- England
£285,000
676,259 sales
- Greater Manchester
£230,000
33,271 sales
- Oldham
£202,000
2,429 sales
Royton
£227,000
297 sales
- Change across the window
- -16.8%
- Sales
- 297
- Share of Oldham
- 12%
10 of 14 places in Oldham, by median
Median sold prices in Royton, compared with the wider area
- England
- Greater Manchester
- Oldham
- Royton
Property type
Bar length is the share of sales. The price is the median.
- Detached£355,00052 sales
- Semi-detached£243,500112 sales
- Terraced£177,500109 sales
- Flat£151,50012 sales
- Other£280,00012 sales
Price spread
Lower and upper quartile. The mark is the median.
£175,100£285,000
How the sales split
- Freehold23% 69 sales
- Leasehold77% 228 sales
- New build2% 5 sales