Southwark house prices
Homes in Southwark sold for a median of £505,000, from 2,585 sales, Oct 2025 – Sept 2026.
The median is £5,000 above Greater London. Sold prices from HM Land Registry, not valuations.
Southwark house prices map
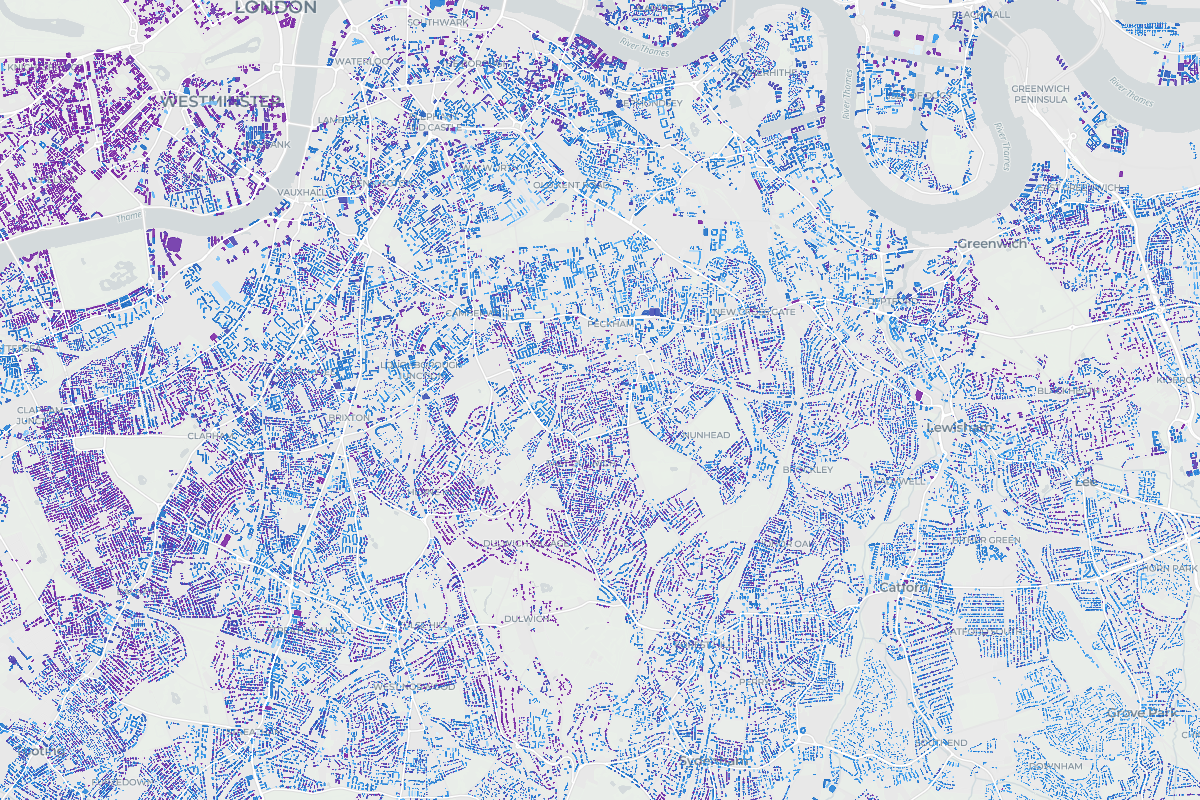
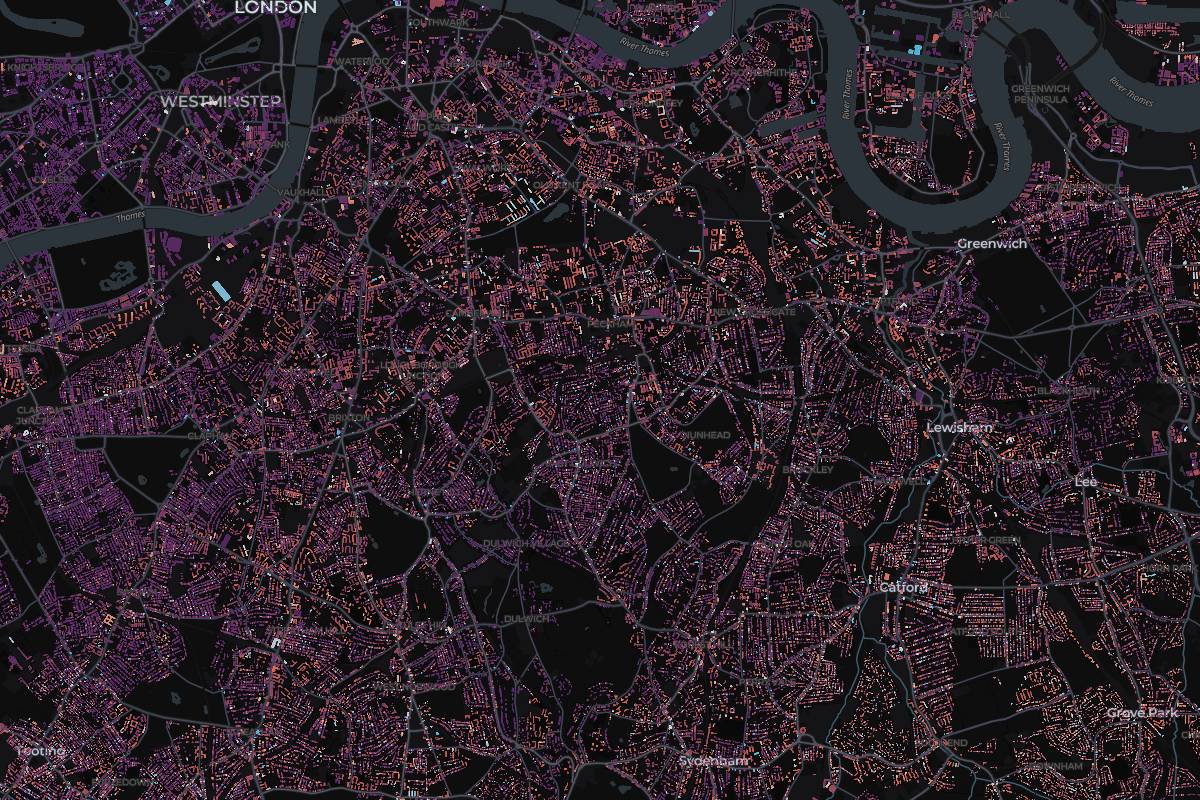
Tap any home in Southwark to see what it sold for.
Most expensive homes in Southwark
Sold Oct 2025 – Sept 2026. Tap a home to see it on the map.
- 1Apartment 75, Benbow House, 24 New Globe WalkFlat · Jan 2026£8,333,000
- 2Apartment 68, Benbow House, 24 New Globe WalkFlat · Jan 2026£8,333,000
- 3105 Burbage RoadDetached · Jun 2026£7,600,000
- 435 Alleyn ParkDetached · Jul 2026£4,350,000
- 588, Balmoral House, Earls WayFlat · Jul 2026£4,250,000
Show 5 moreShow the top 5 only
- 6Apartment 6, Clink Wharf, Clink StreetFlat · May 2026£4,000,000
- 721 Park StreetSemi-detached · May 2026£3,960,000
- 891 Calton AvenueDetached · Oct 2025£3,500,000
- 94 Frank Dixon WayDetached · Jul 2026£3,500,000
- 10Damson House, 17a Grove ParkTerraced · Oct 2025£3,350,000
Most expensive streets in Southwark
Median sold price of streets with 3 or more home sales. Tap a street to see it on the map.
- England
£285,000
676,259 sales
- Greater London
£500,000
74,374 sales
Southwark
£505,000
2,585 sales
- Change across the window
- -1.5%
- Sales
- 2,585
- Share of Greater London
- 3%
19 of 33 places in Greater London, by median
Median sold prices in Southwark, compared with the wider area
- England
- Greater London
- Southwark
Property type
Bar length is the share of sales. The price is the median.
- Detached£1,800,00025 sales
- Semi-detached£1,350,000119 sales
- Terraced£870,000477 sales
- Flat£440,0001,853 sales
- Other£550,000111 sales
Price spread
Lower and upper quartile. The mark is the median.
£375,000£765,000
How the sales split
- Freehold26% 673 sales
- Leasehold74% 1,912 sales
- New build3% 81 sales