City Of London house prices
Homes in City Of London sold for a median of £770,000, from 145 sales, Oct 2025 – Sept 2026.
The median is £270,000 above Greater London. Sold prices from HM Land Registry, not valuations.
City Of London house prices map
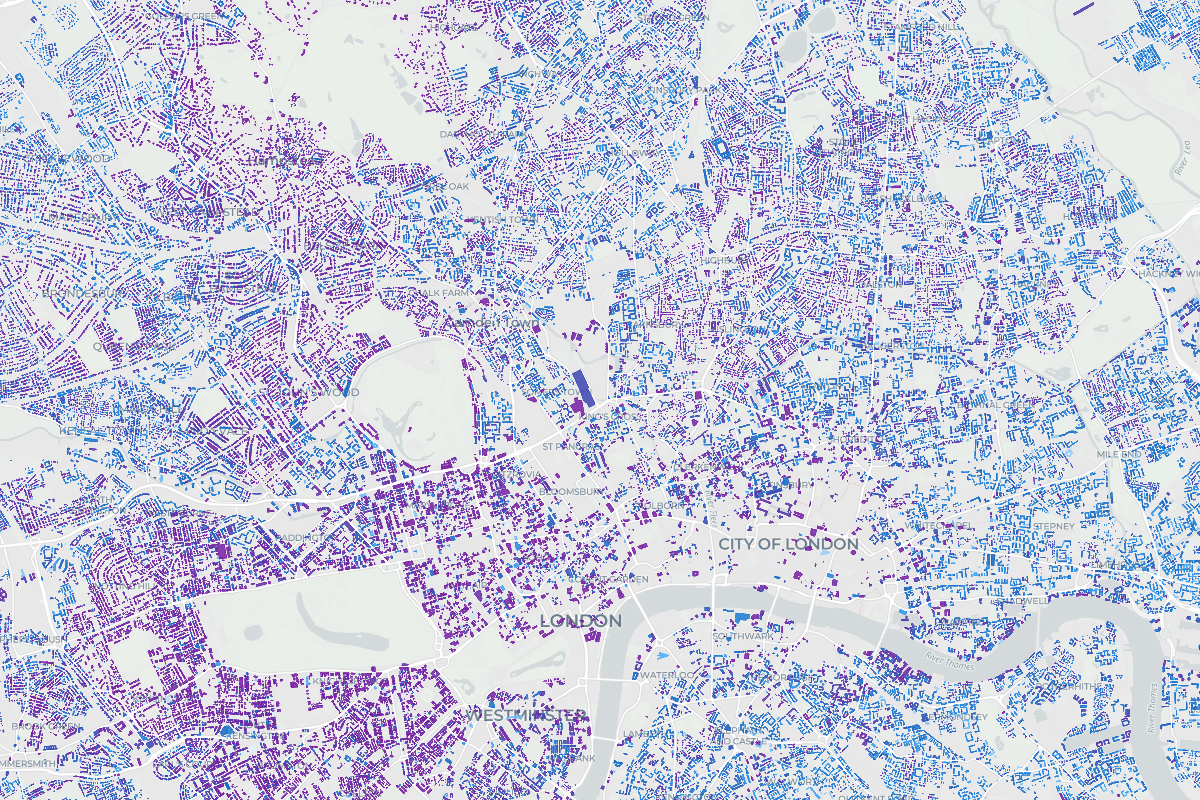
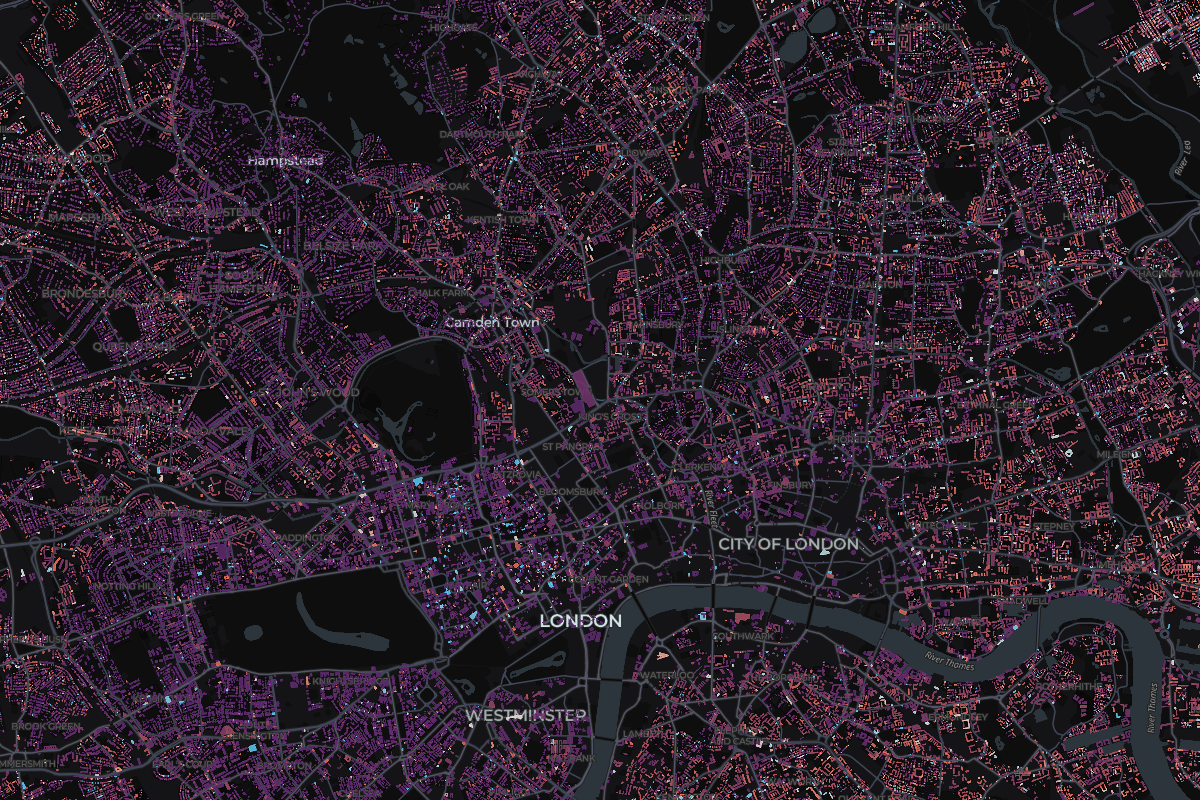
Tap any home in City Of London to see what it sold for.
Most expensive homes in City Of London
Sold Oct 2025 – Sept 2026. Tap a home to see it on the map.
- 131 Circus RoadDetached · Jan 2026£5,666,000
- 2Flat 391, Lauderdale Tower, BarbicanFlat · Jun 2026£2,400,000
- 3Flat 601, 37 Cock LaneFlat · Aug 2026£2,250,000
- 4801 Frobisher CrescentFlat · Dec 2025£2,150,000
- 5Flat 609, Seddon House, BarbicanFlat · Jun 2026£2,150,000
Show 5 moreShow the top 5 only
- 6Flat 323, Shakespeare Tower, BarbicanFlat · Jul 2026£1,775,000
- 7Flat 3, Defoe House, BarbicanFlat · Apr 2026£1,700,000
- 8Apartment 1.5, Dominion House, 59 Bartholomew CloseFlat · Oct 2025£1,690,000
- 9Flat 341, Lauderdale Tower, BarbicanFlat · Feb 2026£1,625,000
- 10Flat 172, Cromwell Tower, BarbicanFlat · Nov 2025£1,600,000
Most expensive streets in City Of London
From most to least expensive. Tap a street to see it on the map.
- Moorgate£22,453,5002 sales
- Giltspur Street£15,850,0002 sales
- Queen Victoria Street£3,925,0002 sales
- Bartholomew Place£2,835,0002 sales
- Ludgate Hill£2,500,0002 sales
- Frobisher Crescent£1,330,0002 sales
- Fleet Street£1,100,0003 sales
- Gresham Street£1,000,0003 sales
- Carter Lane£878,5803 sales
- High Timber Street£872,9503 sales
Show the other 13 streetsShow the top 10 only
- Tudor Street£870,0003 sales
- Barbican£857,50048 sales
- Fetter Lane£665,0002 sales
- Bartholomew Close£649,0008 sales
- Golden Lane Estate£600,0005 sales
- Bridgewater Square£565,0003 sales
- Moor Lane£550,0003 sales
- West Smithfield£503,7506 sales
- Pepys Street£490,0005 sales
- Hosier Lane£475,0002 sales
- Upper Thames Street£472,5004 sales
- Queen Street£470,0002 sales
- Little Britain£134,2503 sales
- England
£285,000
676,259 sales
- Greater London
£500,000
74,374 sales
City Of London
£770,000
145 sales
- Change across the window
- -32.3%
- Sales
- 145
- Share of Greater London
- 0.19%
3 of 33 places in Greater London, by median
Median sold prices in City Of London, compared with the wider area
- England
- Greater London
- City Of London
Property type
Bar length is the share of sales. The price is the median.
- DetachedNot enough sales2 sales
- TerracedNot enough sales2 sales
- Flat£725,000109 sales
- Other£1,282,50032 sales
Price spread
Lower and upper quartile. The mark is the median.
£520,000£1,100,000
How the sales split
- Freehold11% 16 sales
- Leasehold89% 129 sales
- New build0% 0 sales