Plympton house prices
Homes in Plympton sold for a median of £248,750, from 80 sales, Oct 2025 – Sept 2026.
The median is £26,750 above Plymouth. Sold prices from HM Land Registry, not valuations.
Plympton house prices map
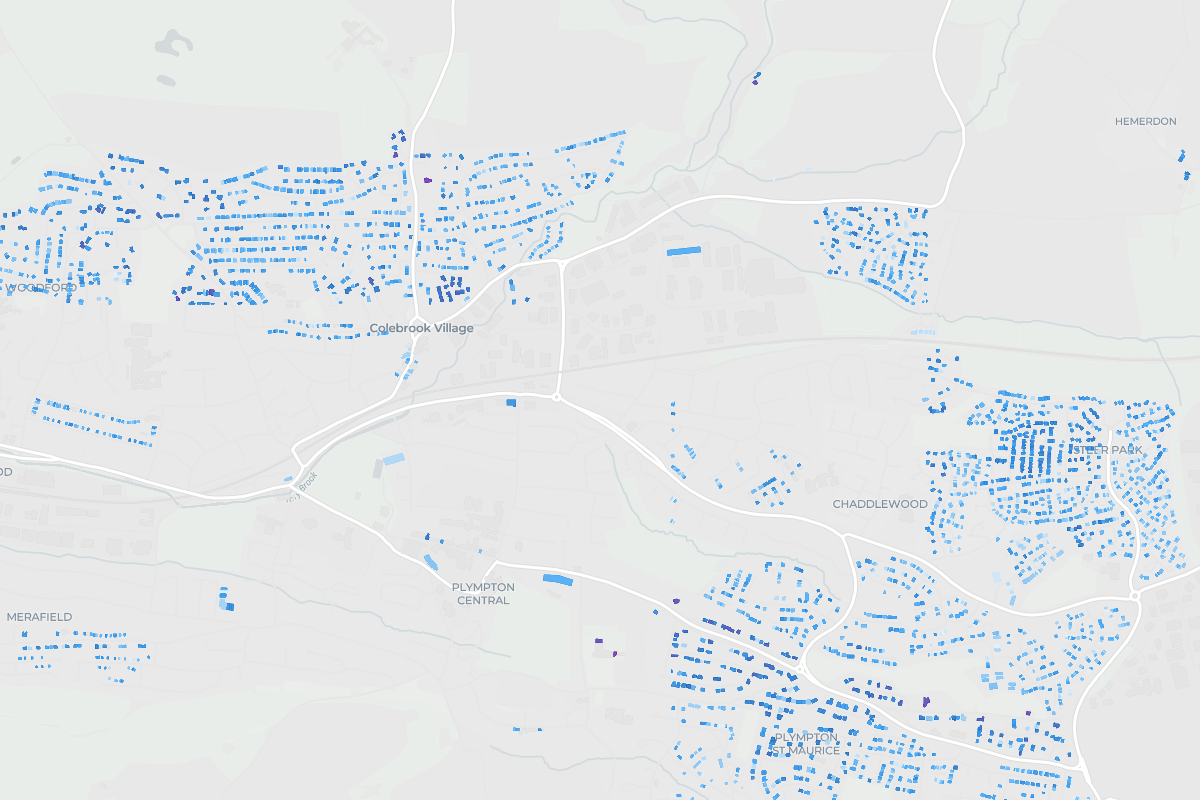
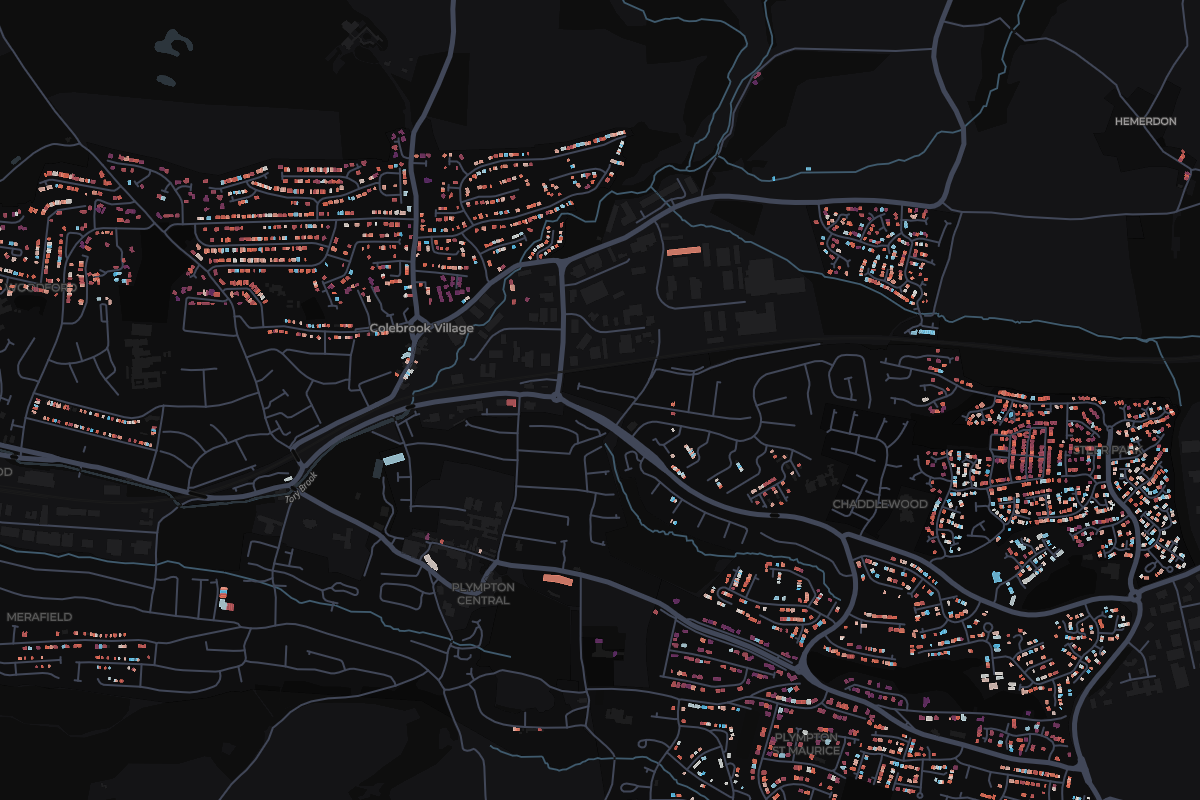
Tap any home in Plympton to see what it sold for.
Most expensive homes in Plympton
Sold Oct 2025 – Sept 2026. Tap a home to see it on the map.
- 147 Trelawny RoadDetached · Jan 2026£725,000
- 27, Hardwick Farm, Drunken Bridge HillDetached · Nov 2025£590,000
- 31 The SpinneyDetached · Aug 2026£540,000
- 456 Plymbridge RoadDetached · Mar 2026£532,500
- 546 Cornwood RoadDetached · Nov 2025£500,000
Show 5 moreShow the top 5 only
- 6Sparkwell House, Colebrook RoadDetached · Dec 2025£487,100
- 7Stowaway, School LaneDetached · Dec 2025£480,000
- 863 Fore StreetTerraced · Jan 2026£477,250
- 927 Plymbridge RoadSemi-detached · Mar 2026£445,000
- 1062 Fore StreetTerraced · May 2026£410,000
Most expensive streets in Plympton
From most to least expensive. Tap a street to see it on the map.
- Plymbridge Road£445,0003 sales
- Fore Street£443,6252 sales
- Elm Grove£400,0003 sales
- Molesworth Road£338,5002 sales
- Colebrook Road£300,0003 sales
- Plymouth Road£298,5008 sales
- Highglen Drive£295,0005 sales
- Underlane£279,0005 sales
- Seymour Road£276,0002 sales
- Westfield£215,00012 sales
Show the other 4 streetsShow the top 10 only
- Change across the window
- +29.5%
- Sales
- 80
- Share of Plymouth
- 2%
6 of 14 places in Plymouth, by median
Median sold prices in Plympton, compared with the wider area
- England
- Devon
- Plymouth
- Plympton
Property type
Bar length is the share of sales. The price is the median.
- Detached£480,00013 sales
- Semi-detached£285,00028 sales
- Terraced£211,25022 sales
- Flat£143,50015 sales
- OtherNot enough sales2 sales
Price spread
Lower and upper quartile. The mark is the median.
£169,250£337,500
How the sales split
- Freehold79% 63 sales
- Leasehold21% 17 sales
- New build0% 0 sales