Willington house prices
Homes in Willington sold for a median of £120,000, from 107 sales, Oct 2025 – Sept 2026.
The median is £7,250 above Crook. Sold prices from HM Land Registry, not valuations.
Willington house prices map
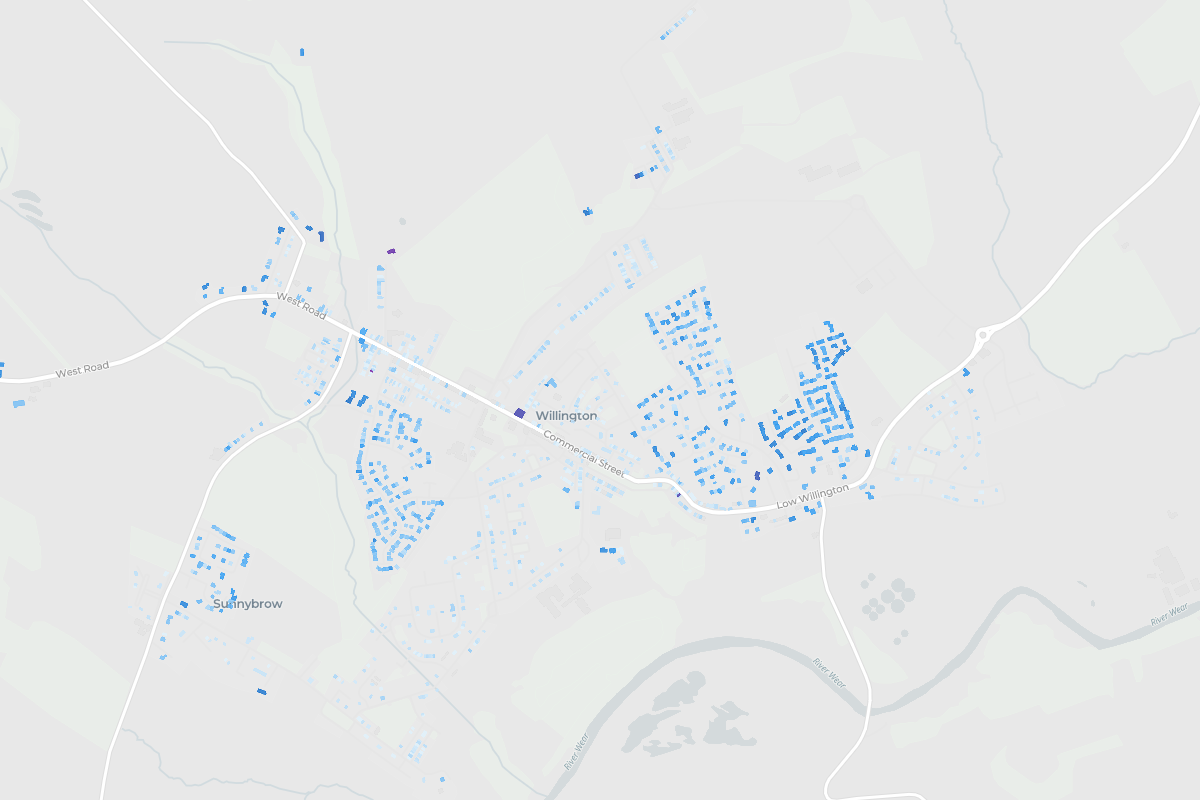
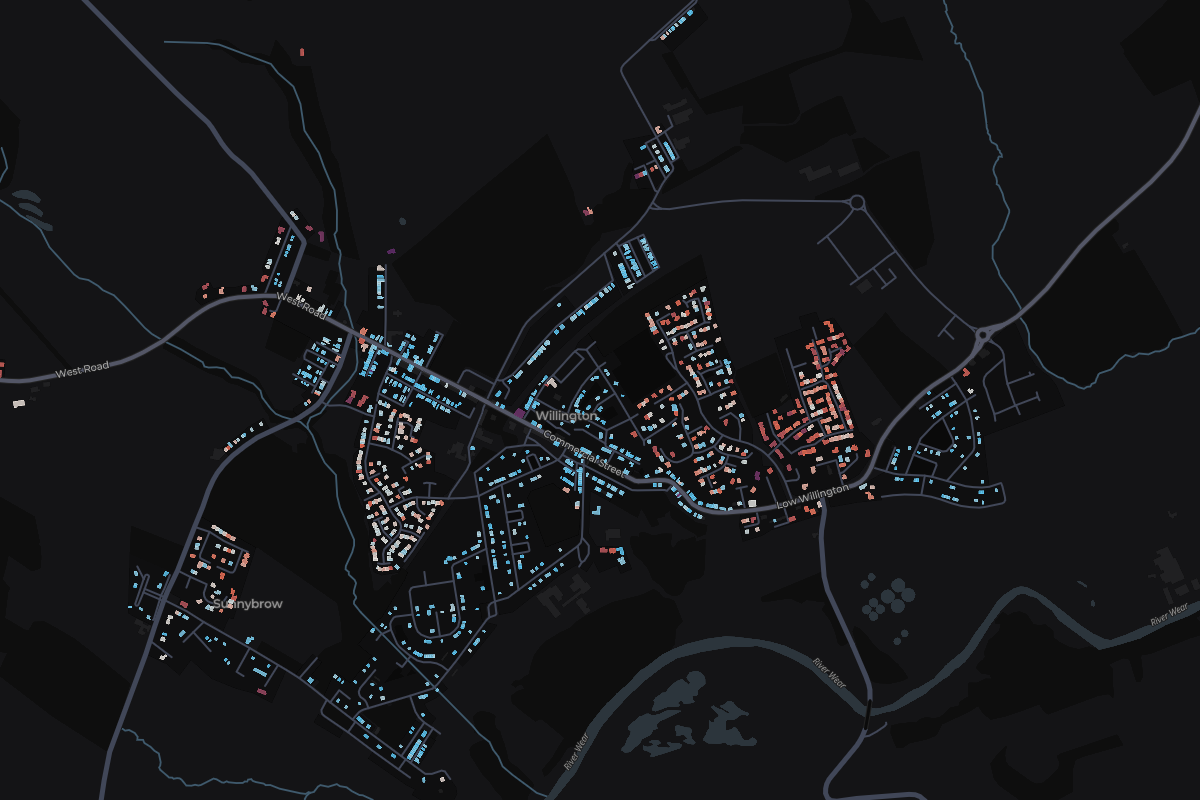
Tap any home in Willington to see what it sold for.
Most expensive homes in Willington
Sold Oct 2025 – Sept 2026. Tap a home to see it on the map.
Most expensive streets in Willington
From most to least expensive. Tap a street to see it on the map.
- Dover Court£291,0002 sales
- Charles Court£229,9952 sales
- Clement Way£227,0003 sales
- Armstrong Drive£224,9503 sales
- Abbey Gardens£218,7504 sales
- Abbots Green£210,0003 sales
- Burnington Drive£194,9982 sales
- Monarch Way£186,9955 sales
- Hill Meadows£176,4952 sales
- Low Willington£155,0007 sales
Show the other 12 streetsShow the top 10 only
- Russell Place£107,5002 sales
- High Street£90,5004 sales
- Hall Lane Estate£86,2504 sales
- Lincoln Drive£84,0002 sales
- Commercial Street£69,0005 sales
- Westmorland Place£66,9754 sales
- Hall Terrace£63,0003 sales
- Belle Vue Terrace£62,5002 sales
- Boyne Street£60,0004 sales
- Coronation Terrace£59,0002 sales
- Carville Terrace£58,0003 sales
- Mill Street£40,0004 sales
- England
£285,000
676,259 sales
- County Durham
£125,000
7,841 sales
- Crook
£112,750
326 sales
Willington
£120,000
107 sales
- Change across the window
- +26.3%
- Sales
- 107
- Share of Crook
- 33%
2 of 6 places in Crook, by median
Median sold prices in Willington, compared with the wider area
- England
- County Durham
- Crook
- Willington
Property type
Bar length is the share of sales. The price is the median.
- Detached£228,74726 sales
- Semi-detached£146,00032 sales
- Terraced£69,41940 sales
- FlatNot enough sales1 sales
- Other£80,9998 sales
Price spread
Lower and upper quartile. The mark is the median.
£69,919£195,000
How the sales split
- Freehold100% 107 sales
- New build5% 5 sales