Wincham house prices
Homes in Wincham sold for a median of £335,000, from 31 sales, Oct 2025 – Sept 2026.
The median is £70,500 above Northwich. Sold prices from HM Land Registry, not valuations.
Wincham house prices map
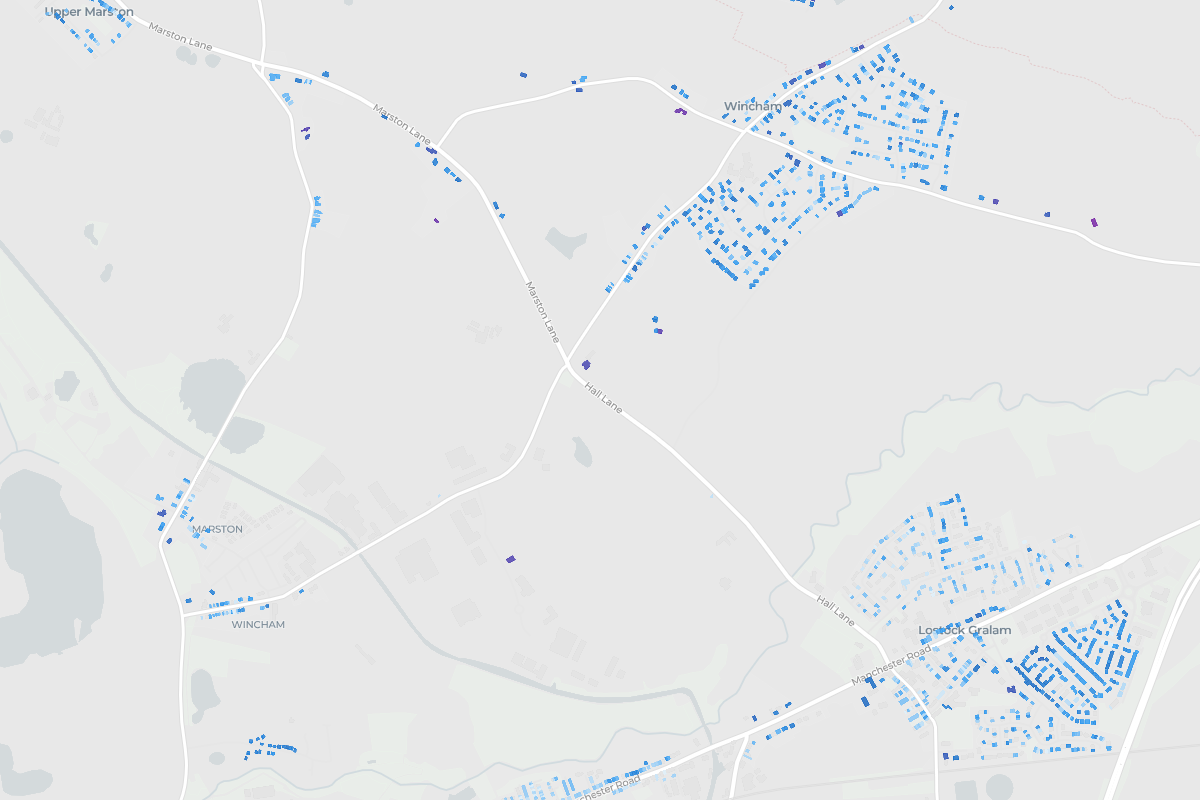
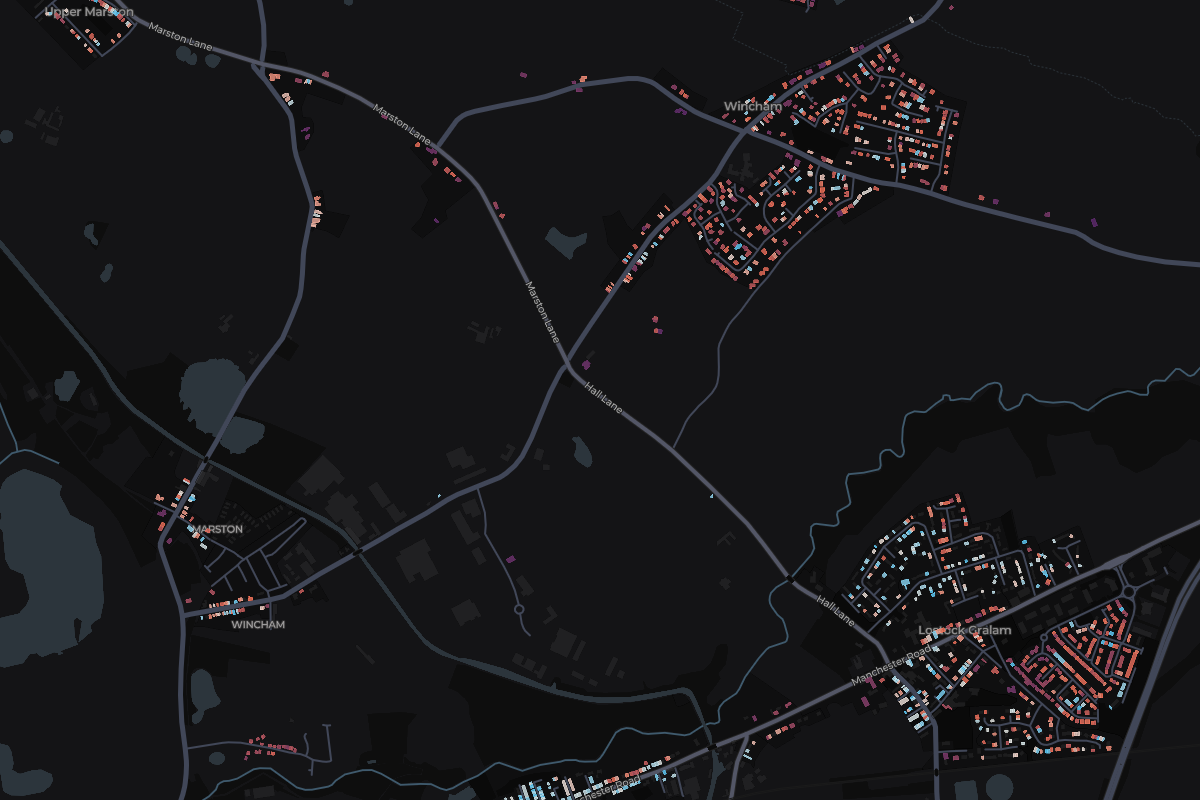
Tap any home in Wincham to see what it sold for.
Most expensive homes in Wincham
Sold Oct 2025 – Sept 2026. Tap a home to see it on the map.
- 1Eden Place, Linnards LaneDetached · Jul 2026£420,000
- 218 Partridge WayDetached · Jul 2026£400,000
- 330 Salt DriveDetached · Jan 2026£390,000
- 483 Shores Green DriveDetached · Dec 2025£380,000
- 511 Pear Tree DriveDetached · Mar 2026£370,000
Show 5 moreShow the top 5 only
- 630 The WoodlandsDetached · Jul 2026£370,000
- 741 Hewitt GroveDetached · Dec 2025£355,000
- 83 Broady AvenueDetached · New build · Oct 2025£349,995
- 98 Salt DriveDetached · New build · Nov 2025£349,995
- 108 Pickmere LaneSemi-detached · Jul 2026£345,000
Most expensive streets in Wincham
From most to least expensive. Tap a street to see it on the map.
- Salt Drive£369,9982 sales
- Broady Avenue£342,4982 sales
- Orchard Close£341,5002 sales
- Pear Tree Drive£341,2502 sales
- Linnards Lane£310,5004 sales
- Shores Green Drive£306,8752 sales
- Green Lane£295,5002 sales
- Keats Lane£291,0003 sales
- Hewitt Grove£245,2504 sales
- England
£285,000
676,259 sales
- Cheshire West And Chester
£260,000
4,853 sales
- Northwich
£264,500
1,178 sales
Wincham
£335,000
31 sales
- Price per square metre
- £4,085
- Sales
- 31
- Share of Northwich
- 3%
Median of recent sales divided by the energy certificate floor area.
10 of 18 places in Northwich, by median
Median sold prices in Wincham, compared with the wider area
- England
- Cheshire West And Chester
- Northwich
- Wincham
Property type
Bar length is the share of sales. The price is the median.
- Detached£347,49718 sales
- Semi-detached£285,00012 sales
- TerracedNot enough sales1 sales
Price spread
Lower and upper quartile. The mark is the median.
£276,250£349,995
How the sales split
- Freehold100% 31 sales
- New build10% 3 sales