Bassingbourn house prices
Homes in Bassingbourn sold for a median of £377,500, from 26 sales, Oct 2025 – Sept 2026.
The median is £67,500 below Royston. Sold prices from HM Land Registry, not valuations.
Bassingbourn house prices map
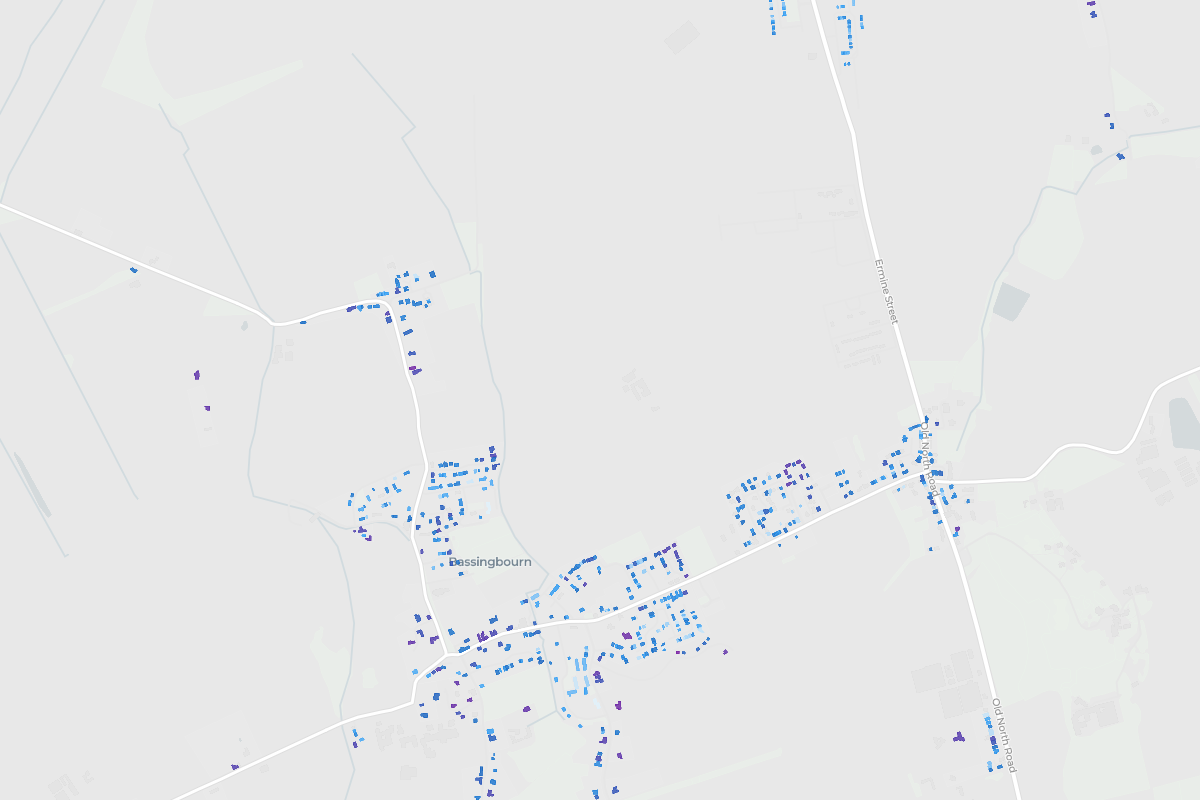
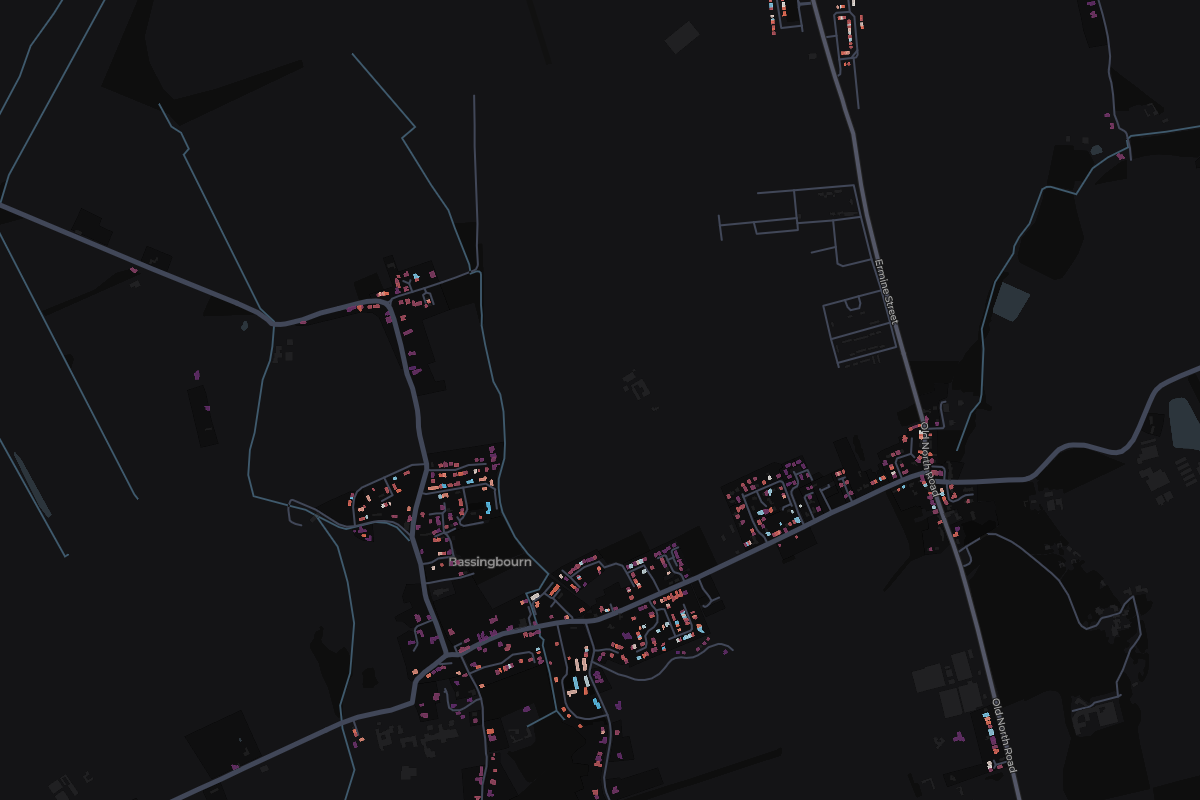
Tap any home in Bassingbourn to see what it sold for.
Most expensive homes in Bassingbourn
Sold Oct 2025 – Sept 2026. Tap a home to see it on the map.
- 120 Shedbury LaneDetached · Jan 2026£852,500
- 2102 Old North RoadDetached · Jun 2026£655,000
- 327 High StreetDetached · Sept 2026£649,000
- 42, Grange Court, Old North RoadSemi-detached · Feb 2026£585,000
- 55 Church CloseDetached · Jun 2026£585,000
Show 5 moreShow the top 5 only
- 6Little Brook House, High StreetSemi-detached · Oct 2025£518,000
- 734 Elbourn WaySemi-detached · Mar 2026£482,000
- 889 High StreetDetached · Apr 2026£460,000
- 9115a The CausewayDetached · Nov 2025£405,000
- 10115 The CausewayDetached · Dec 2025£397,500
Most expensive streets in Bassingbourn
From most to least expensive. Tap a street to see it on the map.
- England
£285,000
676,259 sales
- Cambridgeshire
£335,000
7,978 sales
- South Cambridgeshire
£420,000
1,799 sales
- Royston
£445,000
209 sales
Bassingbourn
£377,500
26 sales
- Price per square metre
- £4,293
- Sales
- 26
- Share of Royston
- 12%
Median of recent sales divided by the energy certificate floor area.
6 of 6 places in Royston, by median
Median sold prices in Bassingbourn, compared with the wider area
- England
- Cambridgeshire
- South Cambridgeshire
- Royston
- Bassingbourn
Property type
Bar length is the share of sales. The price is the median.
- DetachedNot enough sales7 sales
- Semi-detached£375,00012 sales
- TerracedNot enough sales7 sales
Price spread
Lower and upper quartile. The mark is the median.
£330,750£476,500
How the sales split
- Freehold96% 25 sales
- Leasehold4% 1 sales
- New build0% 0 sales