Burwell house prices
Homes in Burwell sold for a median of £343,000, from 73 sales, Oct 2025 – Sept 2026.
The median is £13,000 above East Cambridgeshire. Sold prices from HM Land Registry, not valuations.
Burwell house prices map
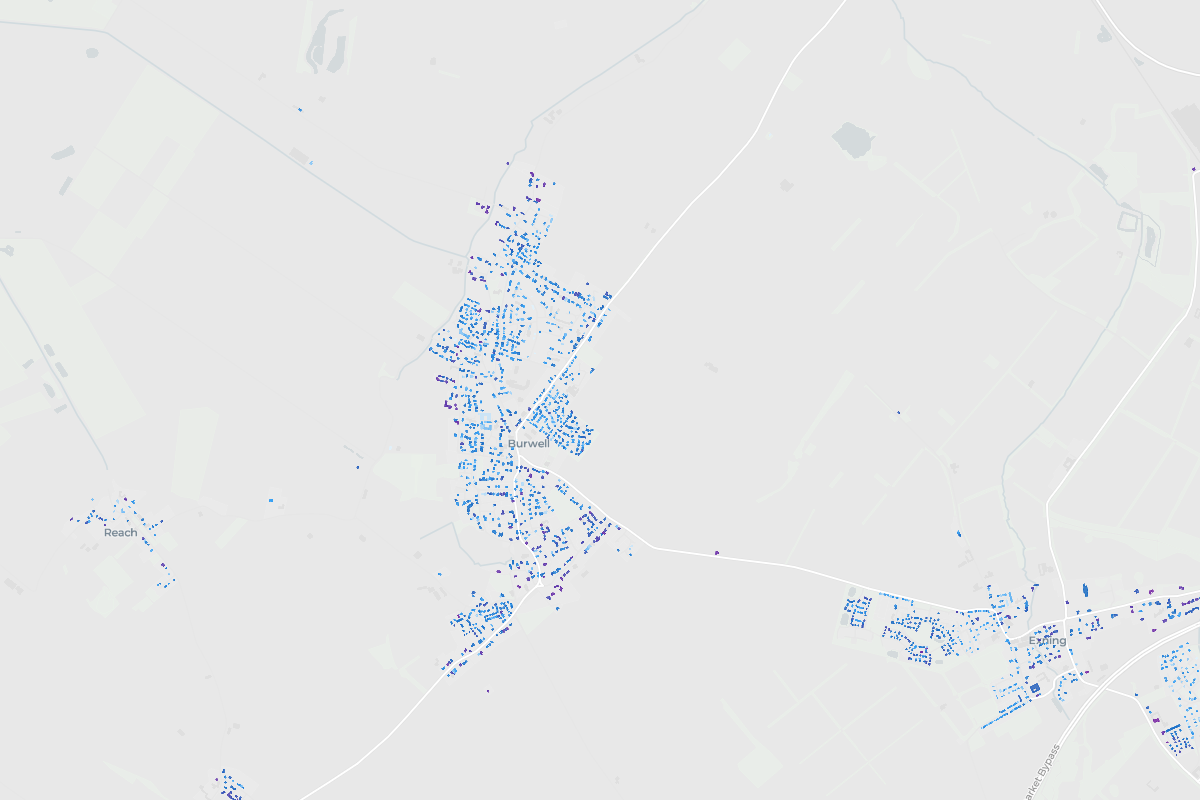
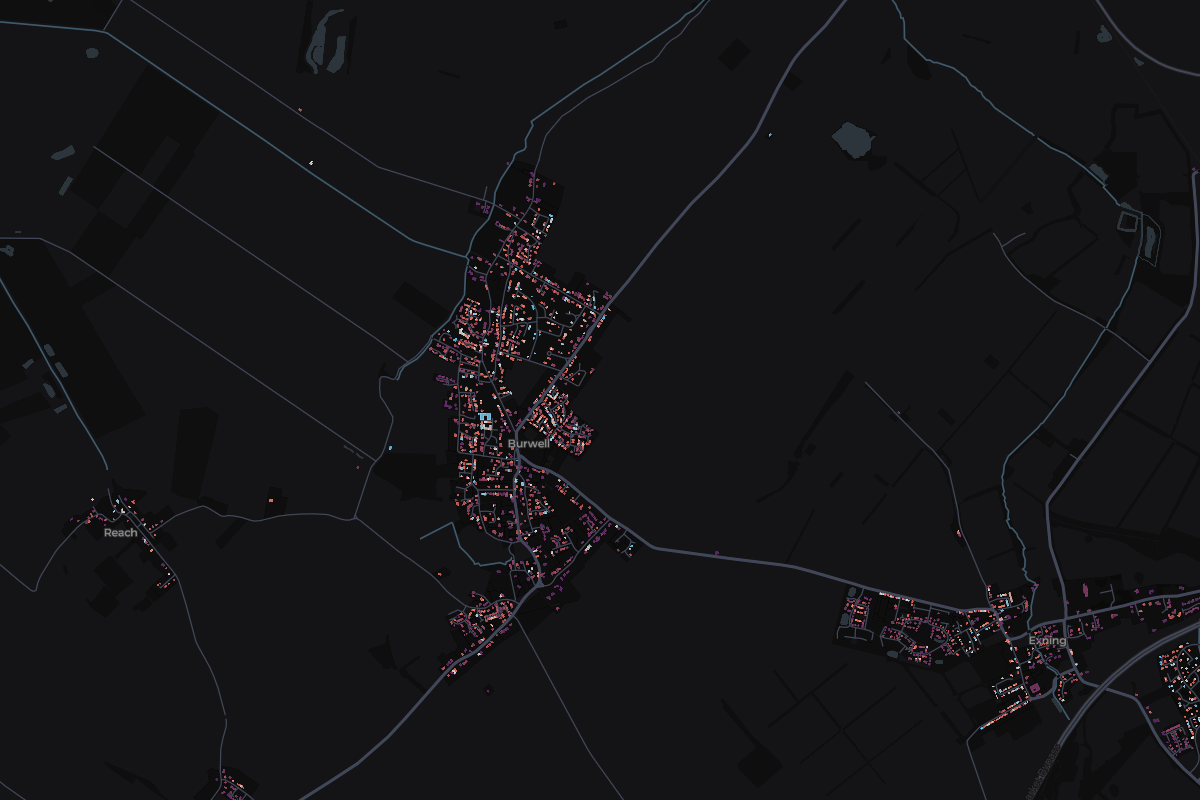
Tap any home in Burwell to see what it sold for.
Most expensive homes in Burwell
Sold Oct 2025 – Sept 2026. Tap a home to see it on the map.
Most expensive streets in Burwell
From most to least expensive. Tap a street to see it on the map.
- North Street£740,0002 sales
- High Street£562,5002 sales
- Hythe Lane£500,0003 sales
- Ness Road£436,5004 sales
- Toyse Lane£420,0003 sales
- Orchard Way£375,0002 sales
- Mandeville£372,5002 sales
- Buntings Crescent£337,5002 sales
- The Causeway£315,0004 sales
- Bewicks Mead£300,0003 sales
Show the other 4 streetsShow the top 10 only
- Hawthorn Way£300,0002 sales
- Kingfisher Drive£255,0002 sales
- Bayfield Drive£249,9505 sales
- Ash Grove£68,0009 sales
- England
£285,000
676,259 sales
- Cambridgeshire
£335,000
7,978 sales
- East Cambridgeshire
£330,000
1,089 sales
Burwell
£343,000
73 sales
- Change across the window
- +1.9%
- Sales
- 73
- Share of East Cambridgeshire
- 7%
5 of 6 places in East Cambridgeshire, by median
Median sold prices in Burwell, compared with the wider area
- England
- Cambridgeshire
- East Cambridgeshire
- Burwell
Property type
Bar length is the share of sales. The price is the median.
- Detached£440,00027 sales
- Semi-detached£365,00015 sales
- Terraced£280,00021 sales
- Flat£67,0008 sales
- OtherNot enough sales2 sales
Price spread
Lower and upper quartile. The mark is the median.
£255,000£440,000
How the sales split
- Freehold86% 63 sales
- Leasehold14% 10 sales
- New build0% 0 sales