Burnham house prices
Homes in Burnham sold for a median of £550,000, from 81 sales, Oct 2025 – Sept 2026.
The median is £100,000 above Buckinghamshire. Sold prices from HM Land Registry, not valuations.
Burnham house prices map
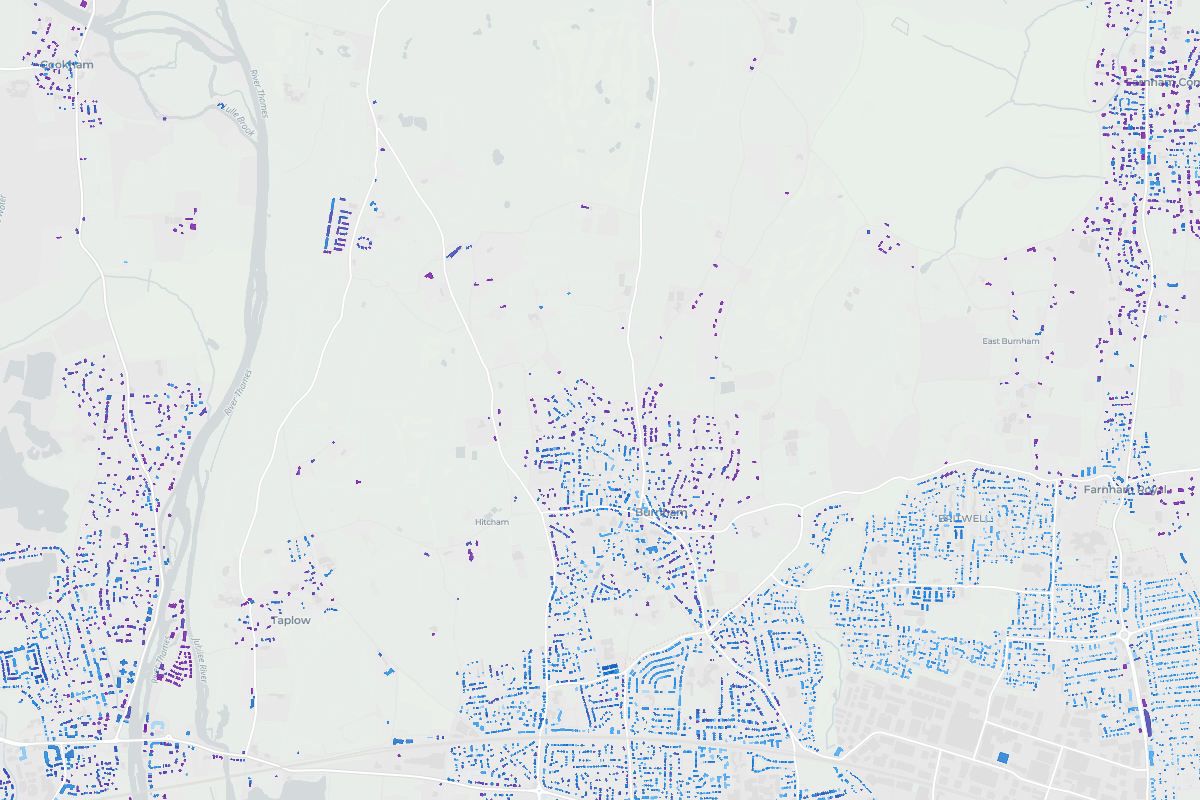
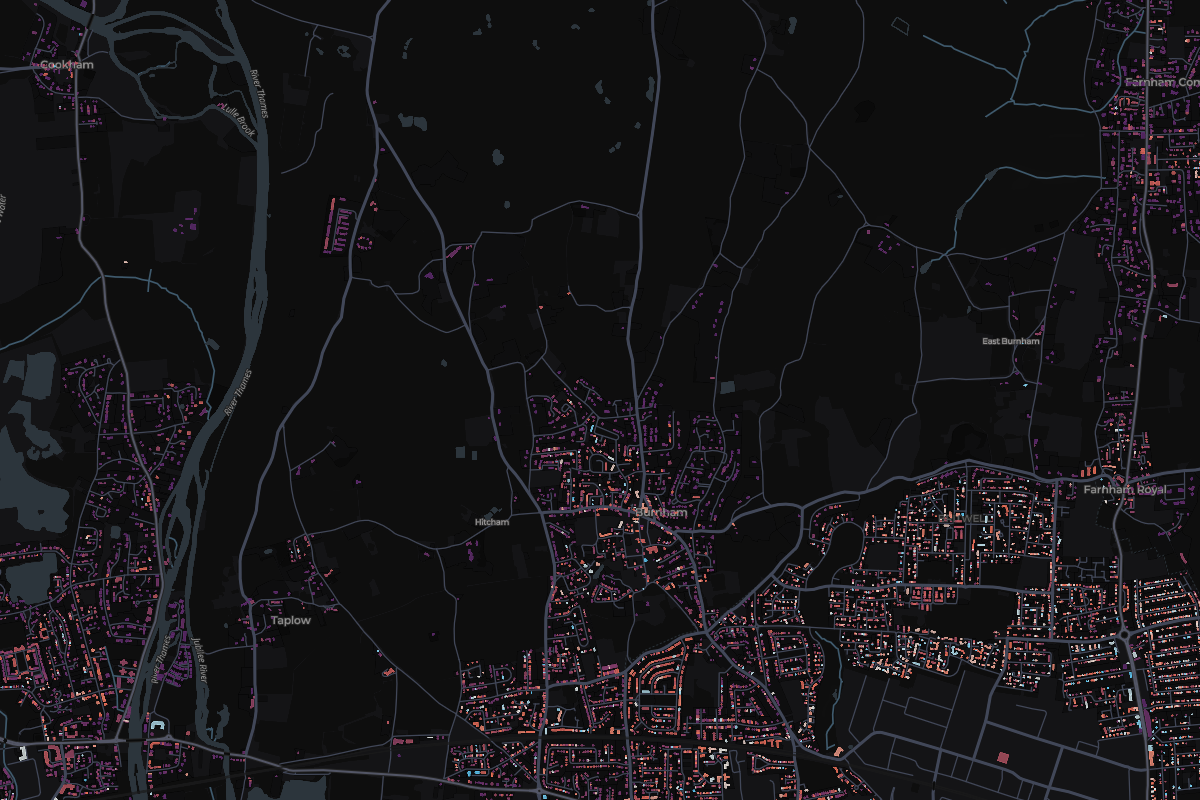
Tap any home in Burnham to see what it sold for.
Most expensive homes in Burnham
Sold Oct 2025 – Sept 2026. Tap a home to see it on the map.
- 195 Dropmore RoadDetached · Apr 2026£1,500,000
- 222a Kimbers DriveDetached · May 2026£1,375,000
- 3Addenbrookes, Dorney Wood RoadDetached · Mar 2026£1,360,000
- 436 Green LaneDetached · Mar 2026£1,145,000
- 529 Linkswood RoadDetached · Oct 2025£1,113,000
Show 5 moreShow the top 5 only
- 617 Green LaneDetached · Jun 2026£1,095,000
- 799 Gore RoadDetached · Feb 2026£1,050,000
- 882 Dropmore RoadDetached · Mar 2026£1,000,000
- 9Conifer House, 6a Hatchgate GardensDetached · Aug 2026£999,000
- 101 Dorneywood CloseSemi-detached · Apr 2026£980,000
Most expensive streets in Burnham
From most to least expensive. Tap a street to see it on the map.
- England
£285,000
676,259 sales
- Buckinghamshire
£450,000
6,382 sales
Burnham
£550,000
81 sales
- Change across the window
- +15%
- Sales
- 81
- Share of Buckinghamshire
- 1%
15 of 33 places in Buckinghamshire, by median
Median sold prices in Burnham, compared with the wider area
- England
- Buckinghamshire
- Burnham
Property type
Bar length is the share of sales. The price is the median.
- Detached£825,00031 sales
- Semi-detached£535,00024 sales
- Terraced£407,50014 sales
- Flat£287,50010 sales
- OtherNot enough sales2 sales
Price spread
Lower and upper quartile. The mark is the median.
£405,000£725,000
How the sales split
- Freehold88% 71 sales
- Leasehold12% 10 sales
- New build0% 0 sales